
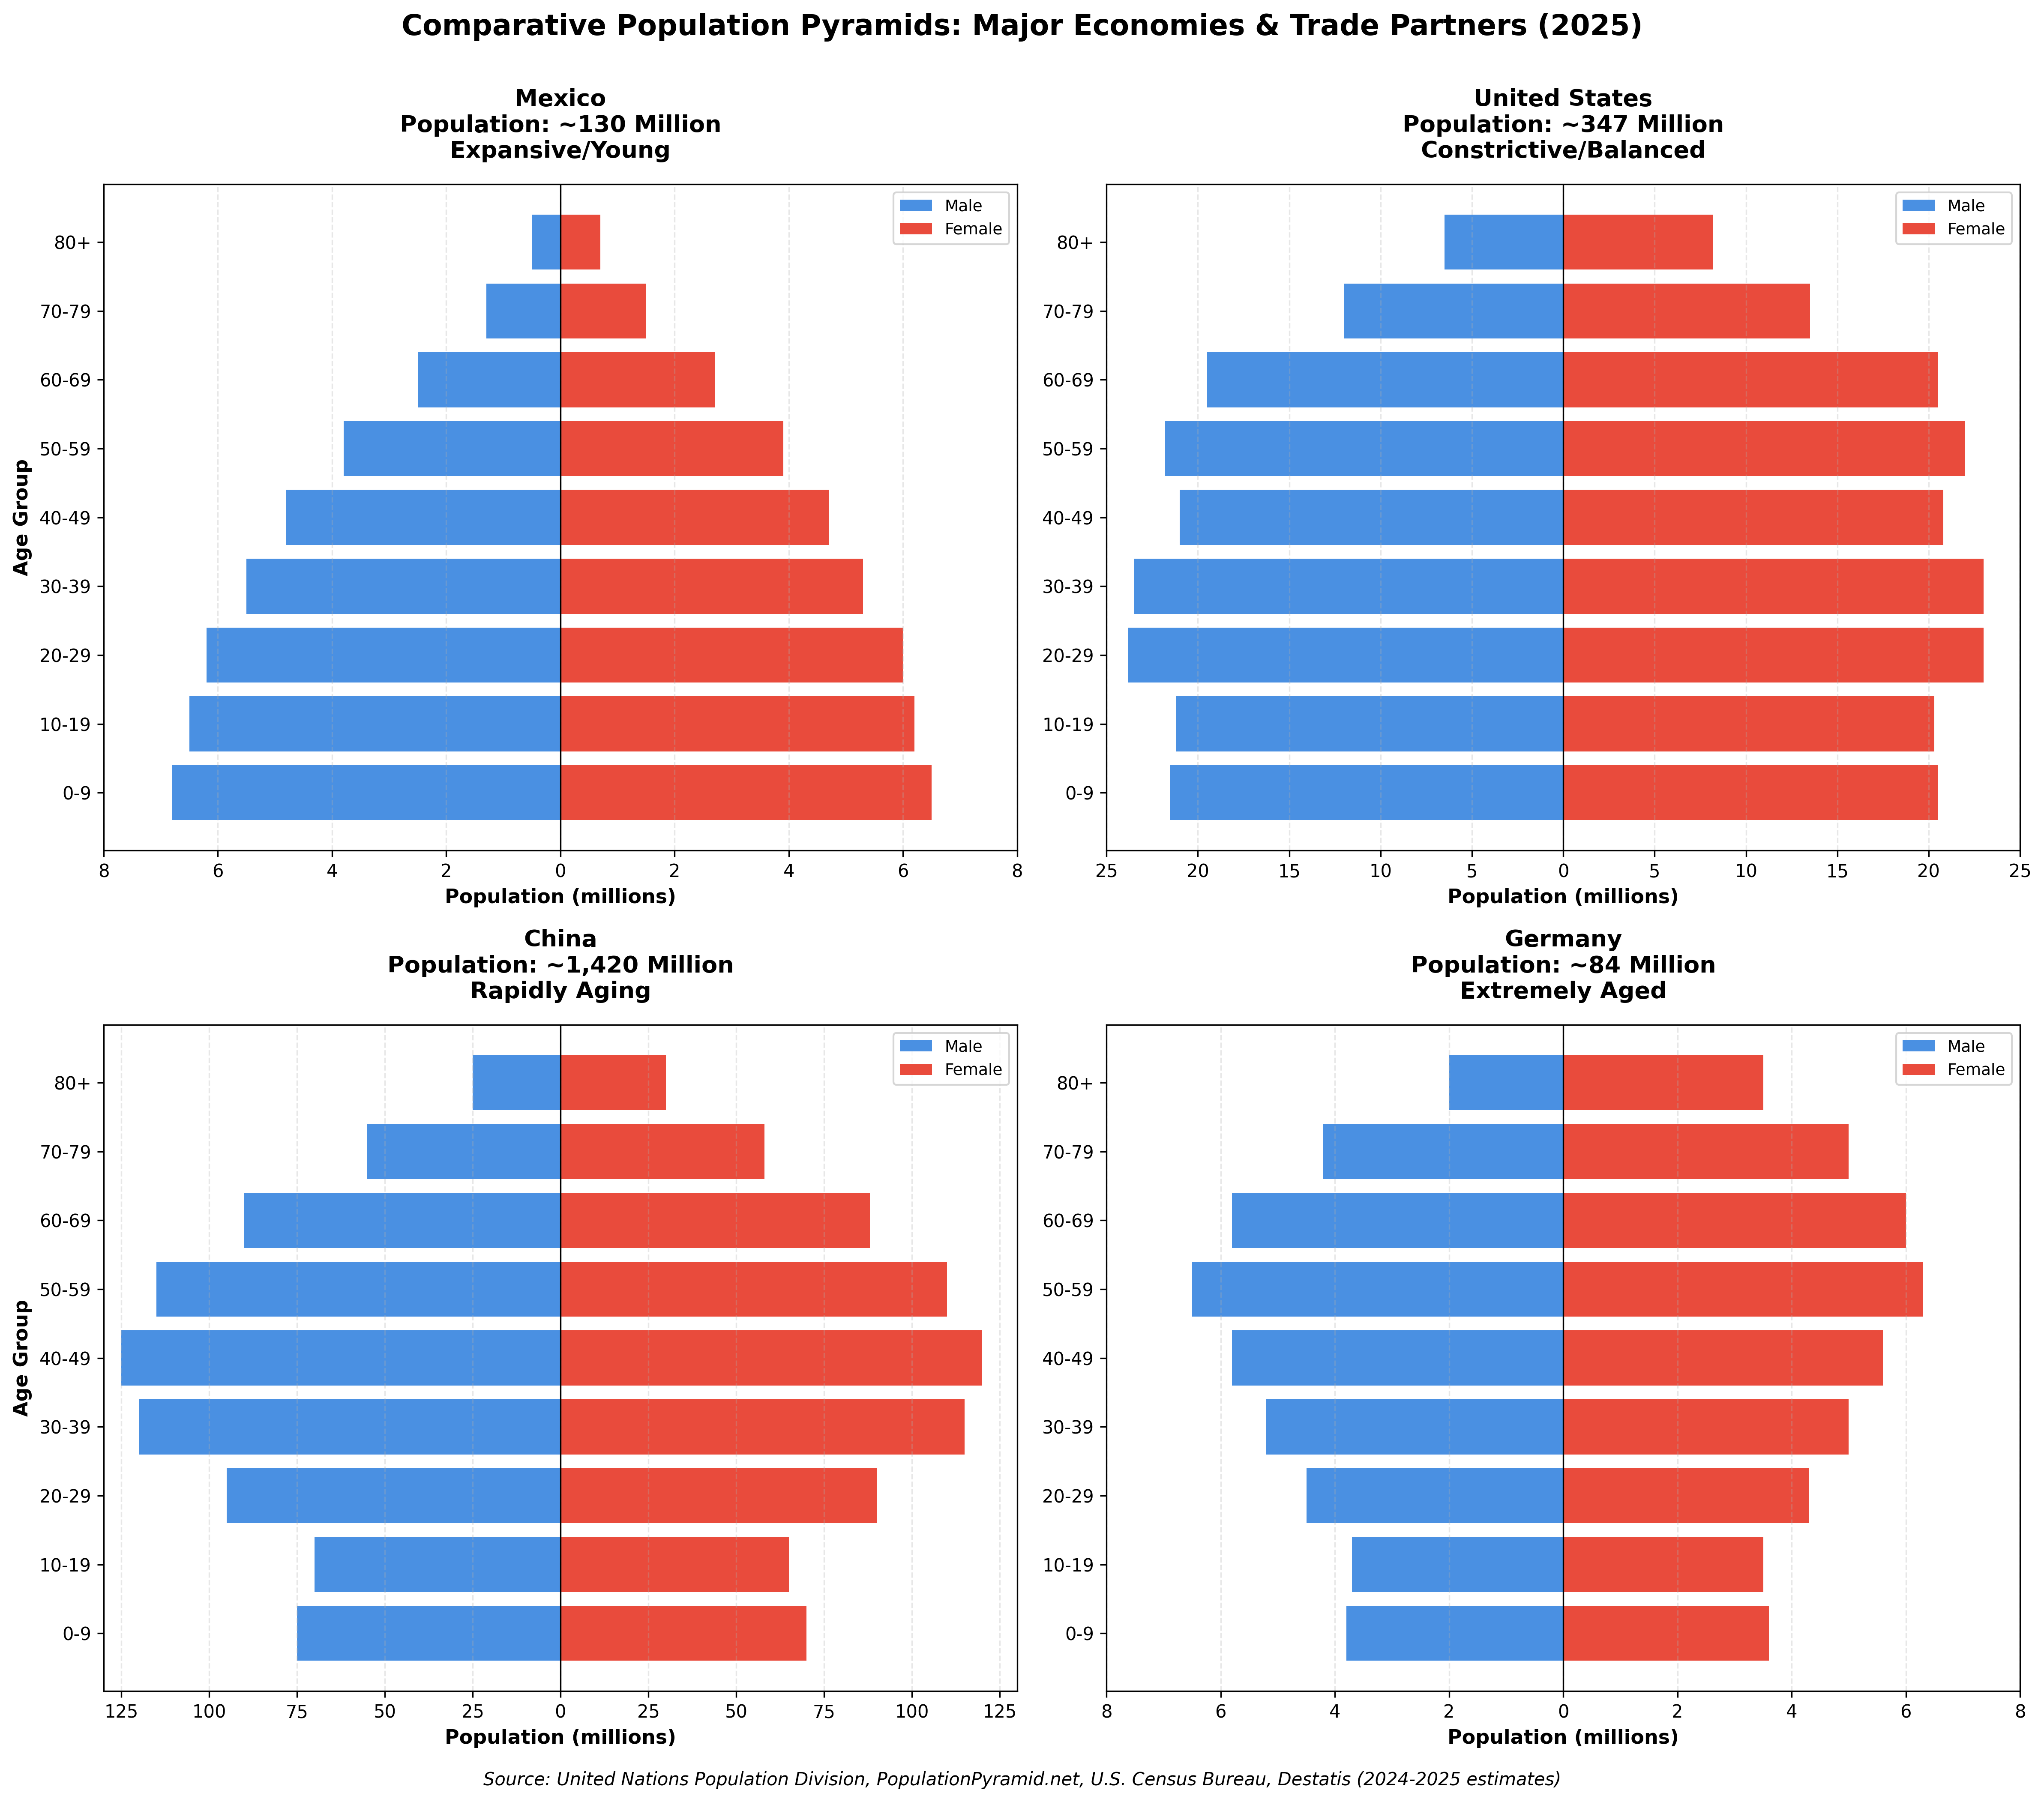
- Four population pyramids below chosen to represent broad demographic categories among America’s primary trading partners.[1]
- Mexico (median age 30): Broad-based, expansive pyramid with a deep labor pool that has helped it become the largest U.S. trading partner.
- China (median age 40) and Germany (median age 45): Constrictive pyramids (largest cohorts aged 40–60) as decades of low fertility contribute to labor shortages.
- United States (median age 39): Transitional demographic profile. Below-replacement fertility of 1.6 births per woman, but with an age structure still shaped by immigration that has historically prevented the severe aging patterns visible in many other developed nations.
Comparative Population Pyramids: Major Economies & Trade Partners (2025)
Key Observations
Six demographic categories
The four economies charted above were selected as trading partners. The categories below are selected on a different rule: to span the full range of age structures that exist anywhere in the world. The two lists are not the same, and the final column reconciles them. It records which categories the United States actually trades with, and the answer is that American goods trade is concentrated almost entirely in the aging half of the world. Of the six categories, the youngest has no member in the U.S. top fifteen trading partners and the next youngest has one.
Categories are defined by mechanism rather than by geography: how an economy arrived at its present age structure, and where that structure goes next. Fertility relative to the replacement rate of roughly 2.1 births per woman is the primary sorting variable, with the pace and cause of the transition separating categories that share a fertility band. Four economies do not sit cleanly on that ladder and are treated separately below rather than forced onto it.
| Category | Exemplar | Representative region | Median age | TFR | Pyramid shape | Countries | Working-age peak | In U.S. top 15 trading partners |
|---|---|---|---|---|---|---|---|---|
| 1 Advanced Aging | Germany | Developed Europe | 45 to 48 | 1.21 to 1.52 | Constrictive | 5 | 1992 to 2009 | Italy, Germany |
| 2 Compressed Aging | Japan | North Asia | 40 to 50 | 0.75 to 1.23 | Constrictive; China notched | 3 | 1995 to 2017 | Japan, South Korea, China |
| 3 Immigration-Sustained | United States | United States, Canada, Australia | 38 to 42 | 1.33 to 1.64 | Stationary | 5 | 2011 to after 2100 | Canada, United Kingdom, France |
| 4 Dividend Open | Mexico | Latin America and mid-tier Southeast Asia | 30 to 37 | 1.13 to 1.88 | Transitional | 8 | 2032 to 2047 | Mexico, Vietnam |
| 5 Young, Converging | India | South and Southeast Asia | 26 to 30 | 1.88 to 2.10 | Transitional to expansive | 3 | 2045 to 2053 | India |
| 6 High Fertility | Nigeria | Sub-Saharan Africa, Pakistan, Egypt | 18 to 24 | 2.71 to 4.30 | Expansive | 5 | 2090 to after 2100 | none |
Thirty-three economies classified, plus four listed separately below. Median age, fertility and working-age peak year from UN World Population Prospects 2024 Revision, medium variant. Trading-partner ranks from the U.S. Census Bureau, goods only on a Census basis, year to date May 2026. (demographics-global.xlsx)
Category definitions and member statistics
Context & Discussion
Diverging demographic trajectories across four economies
Of the four economies represented in the population pyramids above, Mexico is the only one with a clearly expansive pyramid. Its broad base of young workers ensures continued labor supply growth through at least 2050. Germany and China both display constrictive shapes, with their largest population cohorts concentrated between ages 40 and 60, meaning their peak workforce is already aging out of prime productive years. The United States occupies a middle position: a roughly stationary pyramid shape maintained largely by immigration, with below-replacement native fertility partially offset by immigrant inflows that have historically skewed younger.
Mexico’s labor force advantage and nearshoring dynamics
Mexico’s demographic profile gives it a structural advantage in manufacturing competitiveness that extends decades into the future. With a median age of approximately 30, more than a decade younger than China’s 40, Mexico offers a deep and growing pool of working-age labor at a time when most major manufacturing economies face the opposite trajectory.
This labor advantage is reflected in wages. As of 2025, average hourly manufacturing wages in Mexico are approximately $4.90, compared to $6.50 in China: a gap of roughly 25%.[2] That gap has widened over the past decade as Chinese manufacturing wages have risen approximately 7% annually while Mexican wages have remained comparatively stable. The wage differential is reinforced by Mexico’s geographic proximity to the U.S. market (shipping times measured in days rather than weeks), USMCA trade agreement provisions that allow tariff-free access for qualifying goods, and a maturing industrial ecosystem concentrated in cities like Monterrey, Tijuana, and Querétaro.
These dynamics have made Mexico the largest U.S. trading partner as of 2023, a position driven in part by the nearshoring of manufacturing previously located in China. For commercial real estate, the nearshoring trend translates into rising demand for industrial and logistics facilities in U.S.–Mexico border regions (particularly in Texas and Arizona) as well as continued warehouse and distribution investment along the USMCA corridor.
China and Germany will increasingly require labor replacement automation
Both countries have their largest population cohorts concentrated in the 40–60 age range, both have fertility rates well below replacement (China ~1.0, Germany 1.35), and both face accelerating workforce contraction over the next two decades.
China’s demographic trajectory is influenced by the legacy of the one-child policy (1980–2015), which produced a dramatic narrowing of younger cohorts visible in the pyramid above. The working-age population peaked around 2015 and has been declining since. Rising wages, a direct consequence of tightening labor supply, have eroded China’s traditional cost advantage in manufacturing. Combined with U.S.–China trade tensions and tariff escalation, these pressures have accelerated the movement of labor-intensive manufacturing out of China and into Mexico, Vietnam, and India.
Germany’s demographic situation is driven by decades of sustained low fertility rather than a single policy, but the outcome is similar: a shrinking labor force that cannot sustain current economic output without either large-scale immigration or aggressive automation. Germany has pursued both strategies, accepting significant immigration inflows while also investing heavily in advanced manufacturing technology and industrial robotics.
Commercial real estate implications for countries with inverted population pyramids could include increased demand for advanced manufacturing facilities designed for robotic production, data centers to support AI-driven operations, a potential decline in demand for traditional labor-intensive factory space as production either leaves or is automated in place, increased demand for senior housing (short-term) and potentially a reduction in demand for all housing (as seen in Japan with large numbers of vacant houses throughout the country coinciding with a falling overall population).
Cross-border CRE investment implications
The demographic divergences outlined above create identifiable commercial real estate investment themes across borders. Nearshoring demand is concentrated in industrial and logistics facilities in U.S.–Mexico border regions and along major USMCA transportation corridors. Senior housing demand is a common theme across all four economies as populations age, though the timing and severity differ: Germany and China face the most immediate pressure, while the U.S. Boomer cohort drives demand over the next 10–15 years (see U.S. Demographics page for detailed analysis). Automation-driven facilities (data centers, advanced manufacturing, and robotics-enabled production) represent a growth category in aging economies where labor force decline makes traditional manufacturing increasingly unviable.
For U.S.-based CRE investors, the most actionable near-term implication is the durability of the nearshoring trend. Mexico’s demographic advantage is structural and extends to mid-century. As long as USMCA trade provisions remain in place and the U.S.–Mexico wage gap holds, industrial demand in border markets will continue to benefit from supply chain reorganization away from China. However, the nearshoring narrative should not be interpreted as a collapse in Chinese manufacturing output. Despite U.S. tariffs reaching as high as 145% in 2025, China posted a record $1.2 trillion trade surplus for the year (a 20% increase over 2024) by redirecting exports to Southeast Asia, Africa, Latin America, and Europe.[3] Exports of high-tech goods including industrial robots and machine tools rose 13%, while EV, battery, and solar exports surged 27%. China’s manufacturing base is not disappearing; it is shifting up the value chain and diversifying away from U.S. dependence; these dynamics are explored further in the CRE42 Trade Policy section. The U.S. trajectory itself depends heavily on immigration policy, a variable explored in detail in the U.S. Demographics page.
Automation: Aging populations and industrial robot adoption
Industrial robot adoption is accelerating in countries with aging populations. According to the International Federation of Robotics (IFR) World Robotics 2025 report, the five countries with the highest robot density in manufacturing (South Korea 1,220 robots per 10,000 workers; Singapore 818; Germany 449; Japan 446; Sweden 377) all have median ages above 39 and total fertility rates at or below 1.5. The global average is 132 robots per 10,000 workers, and the United States ranks 8th at 307. China’s reported density moved from 470 to 166 per 10,000 between the 2024 and 2025 reports; that is a restatement, not a decline. China’s statistics bureau published updated labor-market data that greatly enlarged the measured manufacturing workforce, so the denominator grew while the robot count kept rising: on the new basis China’s density still climbed 17% year over year, though it now ranks 22nd worldwide.[4] (demographics-global.xlsx)
The contrast with younger economies is equally telling. Mexico (62 robots per 10,000 workers, 2024 data), India (7), and Brazil (17; both 2023 data) have abundant labor forces and correspondingly low robot density.
Commercial real estate implications run in two directions: aging economies will see rising demand for advanced manufacturing facilities designed for robotic production and for the data centers that support AI-driven operations, while younger economies will see continued demand for traditional industrial and logistics space serving human workers. The competition between these two models (cheap labor versus cheap automation) will be one of the defining economic dynamics of the next quarter century, explored further in the CRE42 Technology & AI section and, for the machines actually displacing manufacturing labor in these economies, on the non-humanoid robotics page.
Comparative table: 33 economies
The working-age peak year is the single most consequential column here, because it is the date an economy stops adding workers. It reorders the argument this page makes. China’s working-age population peaked in 2015 and remains within roughly one percent of that peak, which means the decline has barely begun rather than being largely complete. Japan peaked in 1995 and has fallen to 83 percent of its maximum; Germany peaked in 1997, Italy in 1992, South Korea in 2017. Every major U.S. trading partner in the two aging categories is already past its labor-force maximum.
The contrast is sharpest with the United States, which under the medium variant has no working-age peak before 2100, as is also true of Canada and Australia. Mexico peaks in 2047 and India in 2048, which puts a measurable closing date on the demographic dividend that the nearshoring argument depends upon. Nigeria peaks in 2096, and Ethiopia and Pakistan not within the projection horizon at all.
| Country | Category | Pop (M) | Median age | TFR | Share 65+ | 65+ per 100 aged 15–64 | Working-age peak year | 2025 vs peak | GDP/capita | Robots / 10K | U.S. goods trade |
|---|---|---|---|---|---|---|---|---|---|---|---|
| Italy | 1 Advanced Aging | 59.1 | 48.2 | 1.21 | 25.1% | 39.7 | 1992 | 95% | $37,140 | n/p | #14 $50B |
| Germany | 1 Advanced Aging | 84.1 | 45.5 | 1.35 | 23.7% | 38.0 | 1997 | 93% | $52,820 | 449 | #8 $98B |
| Spain | 1 Advanced Aging | 47.9 | 45.9 | 1.23 | 21.6% | 32.9 | 2009 | 98% | $33,090 | n/p | outside top 15 |
| Greece | 1 Advanced Aging | 9.9 | 46.8 | 1.34 | 24.4% | 38.9 | 2009 | 84% | $23,370 | n/p | outside top 15 |
| Portugal | 1 Advanced Aging | 10.4 | 46.9 | 1.52 | 24.9% | 40.0 | 2008 | 92% | $28,380 | n/p | outside top 15 |
| Japan | 2 Compressed Aging | 123.1 | 49.8 | 1.23 | 30.0% | 51.0 | 1995 | 83% | $33,630 | 446 | #6 $99B |
| South Korea | 2 Compressed Aging | 51.7 | 45.6 | 0.75 | 20.3% | 29.3 | 2017 | 95% | $33,150 | 1,220 | #7 $98B |
| China | 2 Compressed Aging | 1416.1 | 40.1 | 1.02 | 14.9% | 21.4 | 2015 | 99% | $12,970 | 166 | #3 $150B |
| United States | 3 Immigration-Sustained | 347.3 | 38.5 | 1.60 | 18.4% | 28.5 | after 2100 | 93% | $85,370 | 307 | reference |
| Canada | 3 Immigration-Sustained | 40.1 | 40.6 | 1.33 | 20.3% | 31.3 | after 2100 | 86% | $55,090 | 241 | #2 $308B |
| United Kingdom | 3 Immigration-Sustained | 69.6 | 40.1 | 1.54 | 19.7% | 31.1 | 2044 | 96% | $49,070 | 112 | #9 $79B |
| France | 3 Immigration-Sustained | 66.7 | 42.3 | 1.64 | 22.5% | 36.8 | 2011 | 99% | $44,410 | n/p | #15 $48B |
| Australia | 3 Immigration-Sustained | 27.0 | 38.3 | 1.64 | 18.1% | 28.2 | after 2100 | 71% | $65,370 | n/p | outside top 15 |
| Mexico | 4 Dividend Open | 131.9 | 29.6 | 1.87 | 8.5% | 12.6 | 2047 | 91% | $11,500 | 62 | #1 $405B |
| Chile | 4 Dividend Open | 19.9 | 36.9 | 1.13 | 14.6% | 21.2 | 2032 | 98% | $16,800 | n/p | outside top 15 |
| Brazil | 4 Dividend Open | 212.8 | 34.8 | 1.60 | 11.5% | 16.6 | 2033 | 100% | $10,300 | n/p | outside top 15 |
| Turkey | 4 Dividend Open | 87.7 | 33.5 | 1.62 | 10.6% | 15.5 | 2036 | 97% | $13,110 | n/p | outside top 15 |
| Argentina | 4 Dividend Open | 45.9 | 32.9 | 1.50 | 12.6% | 19.0 | 2035 | 93% | $13,690 | n/p | outside top 15 |
| Vietnam | 4 Dividend Open | 101.6 | 33.4 | 1.88 | 9.5% | 14.0 | 2037 | 95% | $4,650 | n/p | #5 $106B |
| Colombia | 4 Dividend Open | 53.4 | 32.5 | 1.62 | 10.2% | 14.6 | 2042 | 95% | $7,150 | n/p | outside top 15 |
| Malaysia | 4 Dividend Open | 36.0 | 31.0 | 1.53 | 8.0% | 11.4 | 2047 | 85% | $13,380 | n/p | outside top 15 |
| Indonesia | 5 Young, Converging | 285.7 | 30.4 | 2.10 | 7.5% | 11.1 | 2045 | 92% | $5,110 | n/p | outside top 15 |
| India | 5 Young, Converging | 1463.9 | 28.8 | 1.94 | 7.4% | 10.8 | 2048 | 88% | $2,730 | n/p | #11 $62B |
| Philippines | 5 Young, Converging | 116.8 | 26.1 | 1.88 | 5.7% | 8.5 | 2053 | 84% | $4,070 | n/p | outside top 15 |
| Egypt | 6 High Fertility | 118.4 | 24.5 | 2.71 | 5.3% | 8.3 | 2093 | 60% | $4,020 | n/p | outside top 15 |
| Pakistan | 6 High Fertility | 255.2 | 20.6 | 3.50 | 4.4% | 7.3 | after 2100 | 46% | $1,680 | n/p | outside top 15 |
| Kenya | 6 High Fertility | 57.5 | 20.0 | 3.12 | 3.0% | 5.0 | 2090 | 51% | $2,200 | n/a | outside top 15 |
| Ethiopia | 6 High Fertility | 135.5 | 19.1 | 3.81 | 3.3% | 5.7 | after 2100 | 34% | $1,280 | n/a | outside top 15 |
| Nigeria | 6 High Fertility | 237.5 | 18.1 | 4.30 | 3.1% | 5.4 | 2096 | 42% | $1,620 | n/a | outside top 15 |
| Russia | Outlier | 144.0 | 40.3 | 1.46 | 17.8% | 27.3 | 2010 | 90% | $13,010 | n/p | outside top 15 |
| Thailand | Outlier | 71.6 | 40.6 | 1.19 | 16.0% | 23.0 | 2018 | 98% | $7,170 | n/p | #10 $65B |
| Iran | Outlier | 92.4 | 34.0 | 1.67 | 8.6% | 12.4 | 2038 | 93% | $4,510 | n/p | outside top 15 |
| Saudi Arabia | Outlier | 34.6 | 29.6 | 2.29 | 3.1% | 4.2 | after 2100 | 54% | $32,590 | n/p | outside top 15 |
Sorted by category, then by median age within category. The four economies charted at the top of the page are shown in bold. Population, median age, fertility, share aged 65 and over, old-age dependency ratio and working-age peak year: UN World Population Prospects 2024 Revision, medium variant, 1 July 2025, except fertility for Germany (Destatis) and the United States (CDC NCHS), where the national statistical office is the better authority for its own country. GDP per capita: IMF World Economic Outlook, October 2025. Robot density: IFR World Robotics 2025, data year 2024, on the restated employment denominator; n/p marks economies not published in that edition and n/a those IFR does not cover. U.S. goods trade: Census Bureau, two-way goods on a Census basis, year to date May 2026. (demographics-global.xlsx)
Notes
[1] The four economies charted were selected as major U.S. trading partners, and each also serves as the exemplar of a broader demographic category. Mexico represents mid-stage developing economies whose fertility has fallen below replacement but whose age structure has not yet caught up; China and Germany represent the two distinct routes into advanced aging, one policy-compressed and one gradual; the United States represents the immigration-sustained profile. The full six-category framework, the definitions behind it, and the statistical tables for all thirty-three economies appear in the “Six demographic categories” section above. Categories are defined by mechanism rather than by geography, with fertility relative to the replacement rate of roughly 2.1 births per woman as the primary sorting variable. ↩
[2] Average hourly manufacturing wages: Mexico ~$4.90, China ~$6.50 (2025). Sources: NAPS Inc., Tetakawi, E-Business International. Figures represent national averages; regional variation is significant (Chinese coastal wages tend higher; Mexican border-zone wages may differ from interior). China’s manufacturing wages have risen approximately 7% annually over the past decade. The gap widened from roughly 15–20% in the early 2020s to approximately 25% by 2025. ↩
[3] China’s trade surplus reached a record $1.2 trillion in 2025, with overall exports rising 5.5% despite U.S. tariffs. Exports to the U.S. fell approximately 19.5% but were more than offset by increased shipments to Southeast Asia, Africa, Latin America, and Europe. Source: China General Administration of Customs (January 2026). ↩
[4] Industrial robot density data from the International Federation of Robotics (IFR), World Robotics 2025 report (April 2026 release; data year 2024). Robot density is defined as the number of operational industrial robots per 10,000 manufacturing employees. The 2025 report restated the employment denominator using updated national labor-market data, most significantly for China: earlier editions divided by the Statistical Yearbook’s “urban non-private units” manufacturing employment series (roughly 36 million workers), which excludes private and rural manufacturers, while China’s NBS census counts roughly 105 million manufacturing employees; dividing the same robot stock by the full workforce reproduces the restated 166. As a result, 2024 densities are not comparable with earlier reports; India and Brazil figures are 2023 values from World Robotics 2024 pending public release of their 2024 data. Covers industrial robots in manufacturing only; does not include service robots, warehouse automation, or AI software. ↩
Methodology & Data Notes
Population Data
Population, median age, fertility, share aged 65 and over, the old-age dependency ratio and the working-age peak year are taken from the United Nations World Population Prospects 2024 Revision, medium variant, measured as of 1 July 2025. All were restated from that single source and vintage on 30 July 2026; the previous figures did not reconcile to WPP for twenty of the thirty-three economies and appear to have mixed sources or vintages. Two fertility rates are deliberately not from WPP, because a national statistical office is the better authority for its own country: Germany at 1.35 from Destatis and the United States at 1.6 from CDC NCHS. The working-age peak year is the maximum of the population aged 15 to 64 across 1950 to 2100 under the medium variant; “after 2100” means the series does not peak within the projection horizon. Pyramid shape classifications (Expansive, Transitional, Stationary, Constrictive) are based on standard demographic terminology applied to the UN age-structure data.
Fertility Rate
Total fertility rate (TFR) data is from the World Bank, CDC National Center for Health Statistics (U.S.), and UN WPP 2024. TFR represents the average number of children a woman would have over her lifetime if current age-specific fertility rates remained constant. The replacement-level TFR is 2.1 for developed countries. Country-specific TFR figures cited on this page use the most recent available data (generally 2023 or 2024).
Manufacturing Wages
Wage comparison data (Mexico vs. China) is sourced from NAPS Inc., Tetakawi, and E-Business International, industry consultancies specializing in cross-border manufacturing operations. Figures represent national average hourly manufacturing wages in USD. Regional variation within countries is significant: Chinese coastal manufacturing wages tend higher than inland; Mexican border-zone wages may differ from interior regions. The International Labour Organization (ILO) provides additional context on historical wage growth trends.
Robot Density
Industrial robot density data is from the International Federation of Robotics (IFR), World Robotics 2025 report (data year: 2024). Robot density is defined as the number of operational industrial robots per 10,000 employees in the manufacturing sector. The 2025 report restated the employment denominator using updated national labor-market data; China’s density of 166 reflects a greatly enlarged workforce measure, not a decline in robots (the companion workbook carries both vintages side by side). Densities for France, Thailand, Malaysia, Brazil, and India are 2023 values pending public release of their 2024 figures. This metric covers industrial robots only and does not reflect service robots, warehouse automation systems, software automation, or AI deployment. Countries with very small manufacturing sectors (e.g., Singapore) can achieve high density figures with relatively small total robot stocks.
U.S. Immigration Data
U.S. immigration and population growth figures are from the U.S. Census Bureau Vintage 2025 Population Estimates (released January 27, 2026), supplemented by Brookings Institution analysis by William Frey. Net international migration dropped from 2.7 million (year ending July 2024) to 1.3 million (year ending July 2025), a decline of 54%. The Census Bureau projects a further decline to approximately 321,000 by mid-2026 if current trends continue.
Sources
1. United Nations Population Division. World Population Prospects 2024 Revision. population.un.org/wpp
2. International Federation of Robotics (IFR). World Robotics 2025 report (April 2026 release). Robot density data (2024, restated employment basis); 2023 comparisons from World Robotics 2024. ifr.org
3. U.S. Census Bureau. Population estimates and projections (2025); Vintage 2025 Population Estimates (released January 27, 2026). census.gov
4. International Monetary Fund. World Economic Outlook (October 2025). GDP per capita data. imf.org
5. World Bank. International fertility rate comparisons; GDP per capita data. data.worldbank.org
6. NAPS Inc. “The Cost Advantage in 2025: Manufacturing in Mexico vs. China” (April 2025). Manufacturing wage comparison data. napsintl.com
7. Tetakawi. “Manufacturing Wages in Mexico: 2025–2026 Executive Benchmark Guide” (November 2025). insights.tetakawi.com
8. Destatis (Federal Statistical Office of Germany). Population and demographic data. destatis.de
9. National Bureau of Statistics of China. Population and labor force data. stats.gov.cn
10. PopulationPyramid.net. Visual population structure data. populationpyramid.net
11. CDC National Center for Health Statistics. U.S. fertility rate data. cdc.gov/nchs
12. Congressional Budget Office. Immigration projections and labor force estimates. cbo.gov
13. U.S. Census Bureau, Foreign Trade Division. Top Trading Partners, year to date May 2026. Two-way goods trade on a Census basis. census.gov/foreign-trade
14. China General Administration of Customs. 2025 annual trade data (released January 14, 2026). Reported via Bloomberg, NBC News, Al Jazeera.