
Key Observations
- Conventional industrial robots are reshaping labor markets today: a record 621,000 were installed in 2025, up 15% on 2024 (IFR preliminary).
- Asia took 79% of 2025 installations; the operational stock stood at 4.66 million robots at the end of 2024, with China accounting for 54% of that year’s new installations.
- Aging economies are automating fastest: robot adoption tracks demographic change, led by South Korea at 1,220 robots per 10,000 manufacturing employees, then Singapore, Germany and Japan.
- The United States ranks 8th in robot density (307 per 10,000 employees, up two places), and its 2025 installations rose 11% to 38,000; Baby Boomer retirements and immigration uncertainty concentrate labor-supply risk in agriculture, food processing, construction, and warehouse logistics.
History and Growth of Industrial Robotics
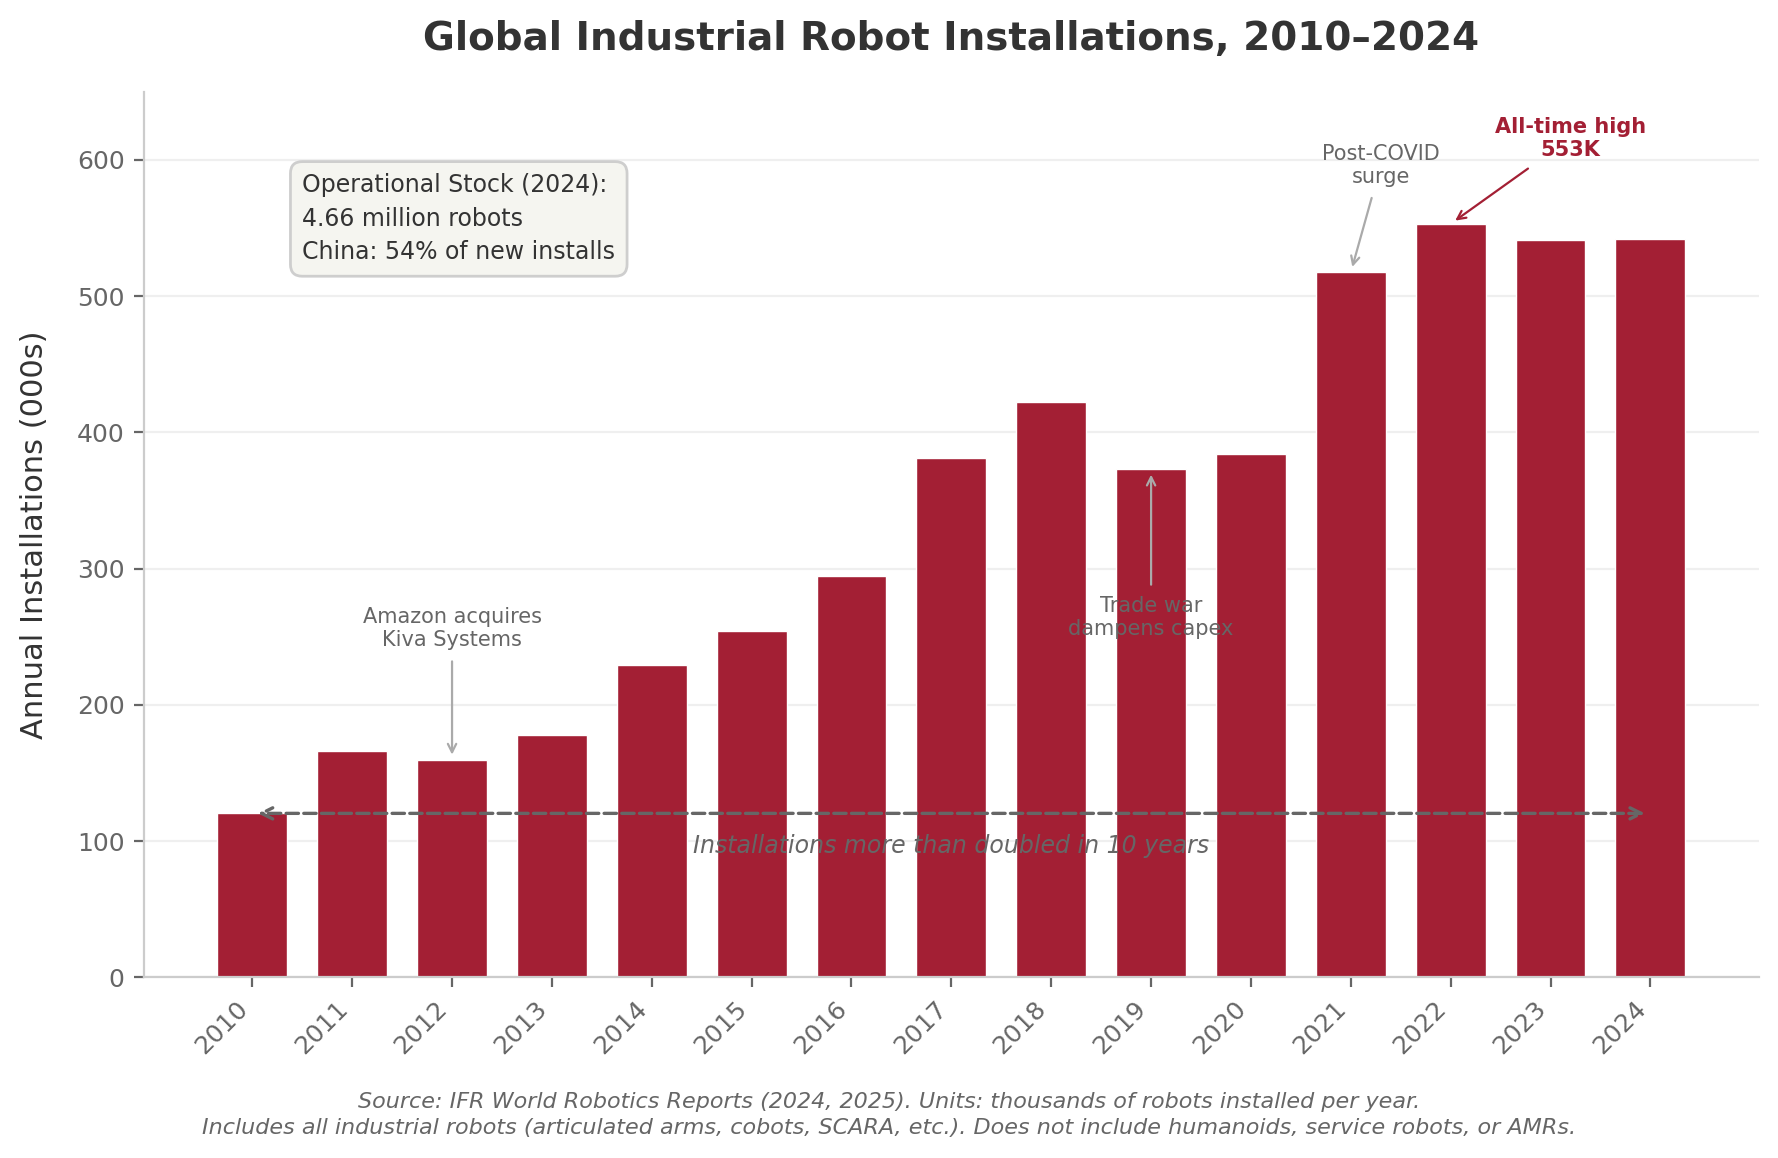
Global Industrial Robot Installations, 2010–2025 (000s of Units; 2025 preliminary) | Source: IFR World Robotics 2025 and IFR preliminary results for 2025 (June 2026). Includes all industrial robots (articulated arms, cobots, SCARA, etc.). Does not include humanoids, service robots, or AMRs.
Annual installations reached a preliminary 621,000 units in 2025, up 15% and a record after four years in the 526,000 to 553,000 range; the total is more than double the 2015 level. Asia took 79% of the year’s installations and grew 21%, while Europe fell 14% and the Americas rose 13%. The operational stock stood at 4.66 million robots at the end of 2024, up 9%, with China accounting for 54% of that year’s new installations.[1] For comparison, global humanoid shipments were about 16,000 units in 2025 and 22,000 in the first half of 2026 (Counterpoint Research),[2] so a full year of humanoid output is still a low single-digit share of industrial robot installations. Electronics widened its lead over automotive as the largest customer industry in 2025 (161,000 units against 139,000). In the United States, installations rose 11% to 38,000 in 2025, with automotive at 13,500 still the largest buyer and food processing the fastest-growing sector at +30%.[6]
Demographics vs. Technology
Labor shortages are accelerating robot adoption. This trend appears to be accelerating in conjunction with advanced nation aging populations and rapid technology advancement.
Acemoglu & Restrepo (2020) found “greater robot adoption in countries with more rapid demographic change”[3]: countries aging fastest are automating fastest, not because robots are cheap but because workers are scarce. South Korea, with the world’s lowest total fertility rate (0.72 in 2023), leads the world in robot density at 1,220 robots per 10,000 manufacturing employees.[1] Germany (median age 46.6, TFR 1.46) and Japan (median age 49, TFR 1.2) follow among the large economies, at 449 and 446.[4] China, entering the same demographic trap as Japan and Korea but at lower per-capita income, has responded with the most aggressive government robotics policy (MIIT 2023–2025 humanoid plan). In May 2026, China’s 15th Five-Year Plan placed robotics at the center of its industrial strategy; China’s operational robot stock of roughly 2 million units is about 4.5 times Japan’s, the global number two.[5]
The United States (median age 38.9, TFR 1.62)[4] ranks 8th globally in robot density at 307 per 10,000 employees, up two places in the 2024 ranking.[1] Baby Boomer retirements (roughly 10,000 Americans per day reaching age 65 from 2010 through 2030) combined with post-2025 immigration policy uncertainty create labor supply risk concentrated in sectors that already struggle to fill positions: agriculture, food processing, construction, and warehouse logistics. Whether the U.S. fills these gaps through immigration policy, automation, or some combination will be among the most consequential labor market questions of the next decade, with direct implications for CRE demand across industrial, retail, and multifamily property types.
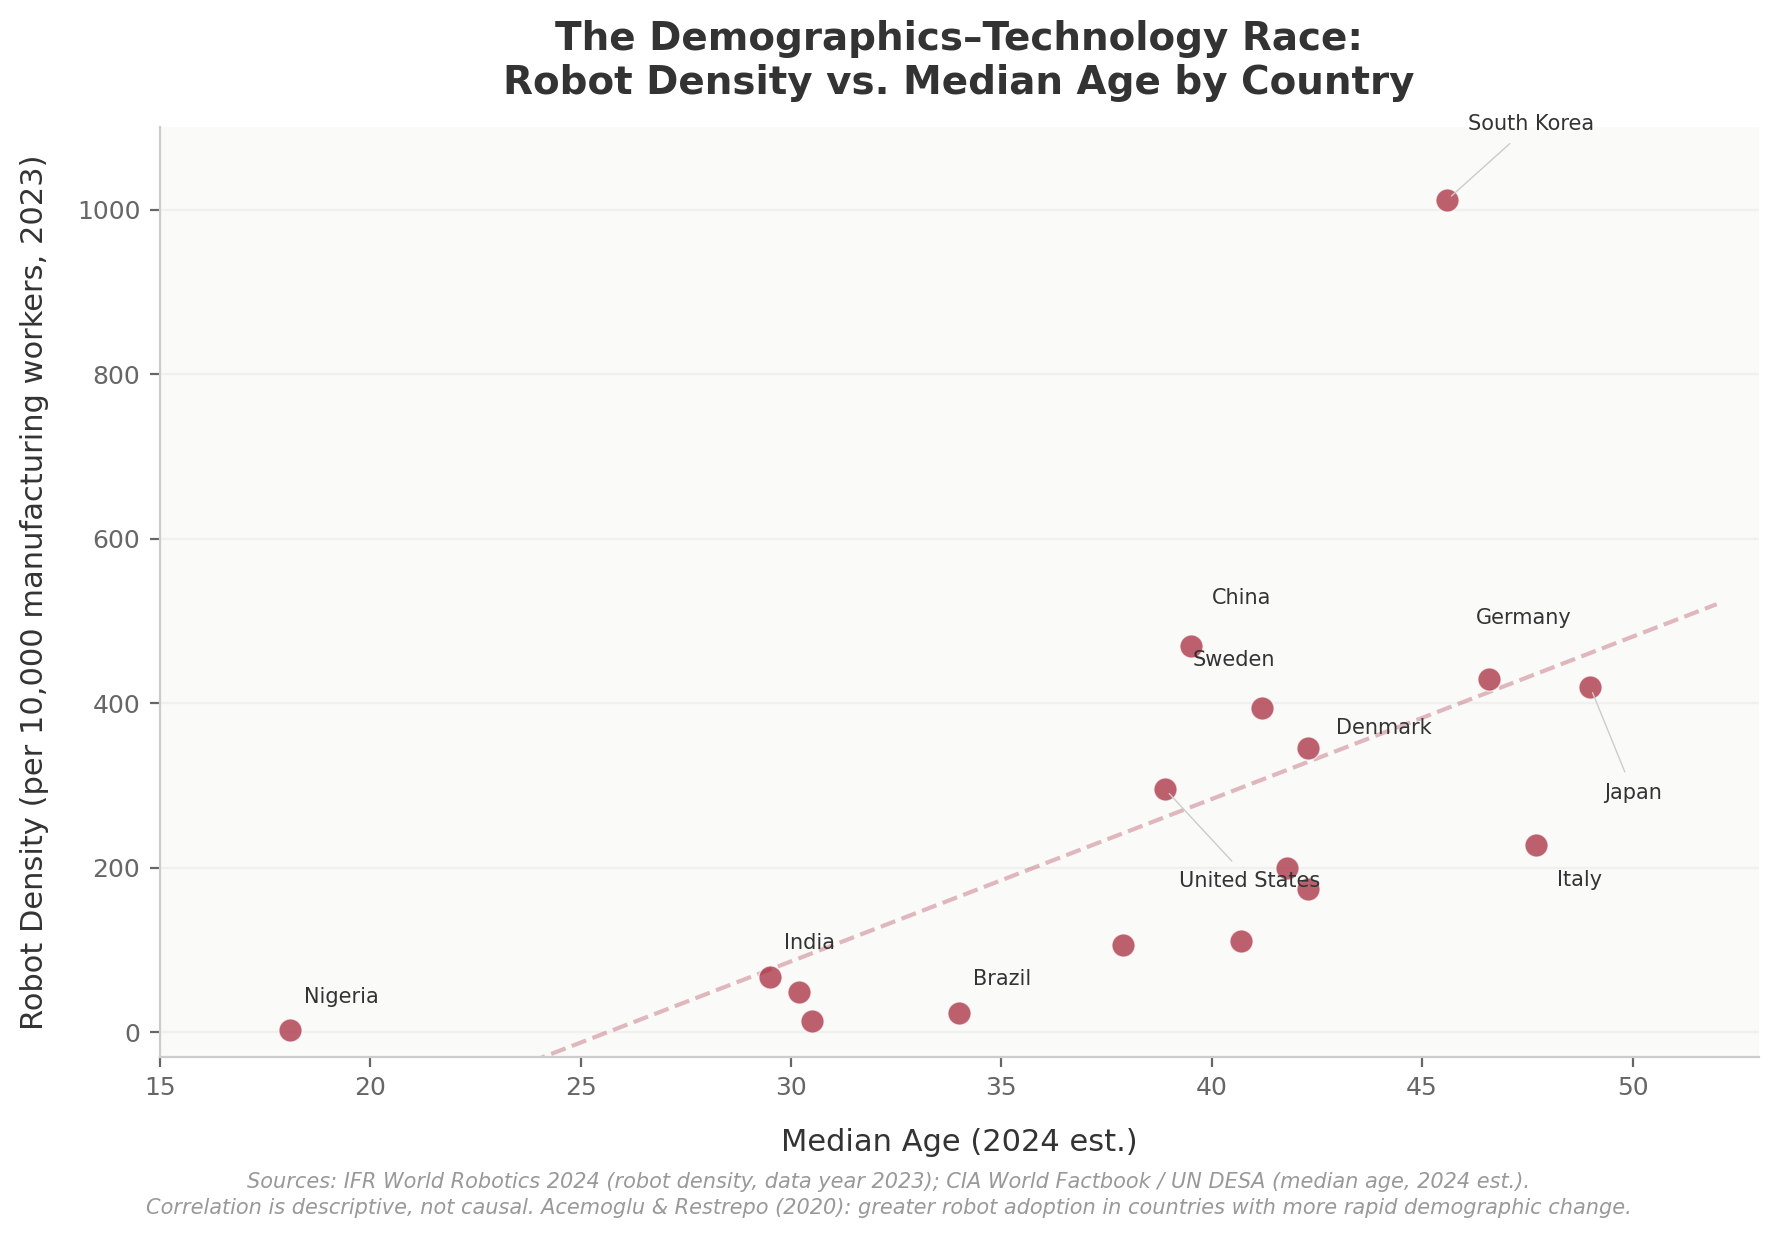
The Demographics–Technology Race: Robot Density vs. Median Age by Country | Sources: IFR (robot density, data year 2024, preliminary June 2026); CIA World Factbook / UN DESA (median age, 2024 est.)
What to Watch in 2026
| Subject | Key Source(s) | Expected Next Release |
|---|---|---|
| Global industrial robot installations | IFR World Robotics Report | World Robotics 2026 (final 2025 data, operational stock, country tables): September 24, 2026 |
| Robot density by country | IFR Robot Density Data | Full 2024 country table with World Robotics 2026 (Sept 24, 2026); the chart above will be extended to the remaining countries then. Key: whether U.S. density keeps gaining on Europe and Asia |
[1] IFR (International Federation of Robotics), preliminary results for 2025 as presented at the IFR Executive Roundtable, Chicago, June 24, 2026: global installations 621,000 (+15%); regional shares Asia 79%, Europe 12%, Americas 9%; customer industries electronics 161,000, automotive 139,000, metal and machinery 98,000; robot density 2024 (industrial robots in operation per 10,000 manufacturing employees): South Korea 1,220, Singapore 818, Germany 449, Japan 446, United States 307 (8th), global average 132. Operational stock 4.66 million and China’s 54% share of 2024 installations from World Robotics 2025. Final 2025 figures appear in World Robotics 2026 (September 24, 2026). IFR revised the employment base of its density series in 2026, so the 2024 figures are not directly comparable with the 2023 figures previously shown here (global average 162; South Korea 1,012; United States 295). ifr.org ↩
[2] Counterpoint Research: approximately 16,000 humanoid units shipped globally in 2025 (Jan 14, 2026) and more than 22,000 in the first half of 2026, close to +300% year over year (Aug 20, 2026). counterpointresearch.com ↩
[3] Acemoglu, Daron, and Pascual Restrepo. “Robots and Jobs: Evidence from US Labor Markets.” Journal of Political Economy 128, no. 6 (2020): 2188–2244. Finds greater robot adoption in countries undergoing more rapid demographic change. journals.uchicago.edu ↩
[4] CIA World Factbook and UN DESA, median age and total fertility rate by country (2023–2024 est.): South Korea TFR 0.72; Japan median age 49, TFR 1.2; Germany 46.6, TFR 1.46; United States 38.9, TFR 1.62. cia.gov ↩
[5] China Ministry of Industry and Information Technology (MIIT), humanoid robotics guidance (2023–2025); China’s 15th Five-Year Plan (2026), placing robotics at the center of industrial strategy; operational robot stock of roughly 2 million units (about 4.5x Japan). ↩
[6] IFR press release, “US Robot Industry Returns to Double Digit Growth” (June 18, 2026): 38,000 industrial robots installed in the United States in 2025 (+11%); automotive 13,500 (−1%); food industry about 3,000 (+30%); metal and machinery and electrical/electronics about 3,000 each; US robot density 307 per 10,000 manufacturing employees, 8th globally, up two places. ifr.org ↩
Sources
[1] IFR, World Robotics 2025; IFR preliminary results 2025 (Executive Roundtable, June 24, 2026); IFR US press release (June 18, 2026). ifr.org
[2] Counterpoint Research, humanoid robot shipments (Jan 14 and Aug 20, 2026). counterpointresearch.com
[3] Acemoglu & Restrepo, “Robots and Jobs” (JPE 2020). journals.uchicago.edu
[4] CIA World Factbook; UN DESA, World Population Prospects. cia.gov
[5] China MIIT humanoid robotics guidance; China 15th Five-Year Plan (2026).
Companion workbook. technology-ai-blue-collar.xlsx: shared robotics and physical AI workbook covering IFR installation data, robot density by country, and the demographics–technology race data