
Advancing automated vehicle technology is already starting to disrupt labor markets (see the previous page, Automated Driving and Driving Jobs), and we are likely only at the very beginning of a rolling labor market disruption which will play out over the next decade. All driving jobs are potentially replaceable with automation, but the time frame will be influenced by the technology itself, government regulation (federal, state and local), societal adoption and acceptance, and economic factors. Similar to Physical AI and Blue-Collar Work: Geographic Exposure, we do not attempt to apply individual automation scores for respective driving jobs. Driving jobs concentrations by state below.
In addition to job displacement, automated driving will likely have significant influence on geographic and demographic growth patterns as passenger vehicles (both user owned and robotaxis) become increasingly automated. At this stage, it is uncertain if the conventional wisdom that people will choose to live further from population centers if they have access to fully self-driving vehicles, removing the “friction” from getting into urban entertainment districts.
Another article of faith for many AV pundits is that automated vehicles will reduce traffic and parking requirements with traffic efficiency (i.e. better robot drivers, fewer accidents, etc.) and robotaxis with the ability to drop off their passengers and park outside the area. CRE42 questions both of these assertions. Improving the passenger experience is highly unlikely to result in the American consumer wanting to own fewer cars, and the idea that passengers will agree to wait for their vehicles to return from outside of the area to pick them up also appears unlikely to us.
Driving-Job Concentration by State
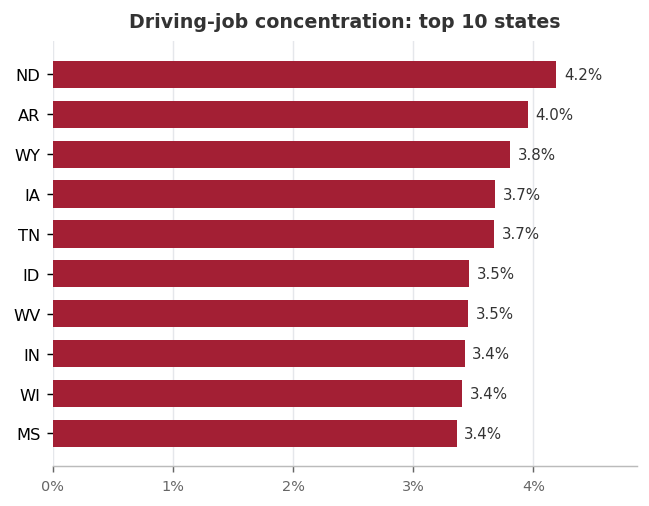
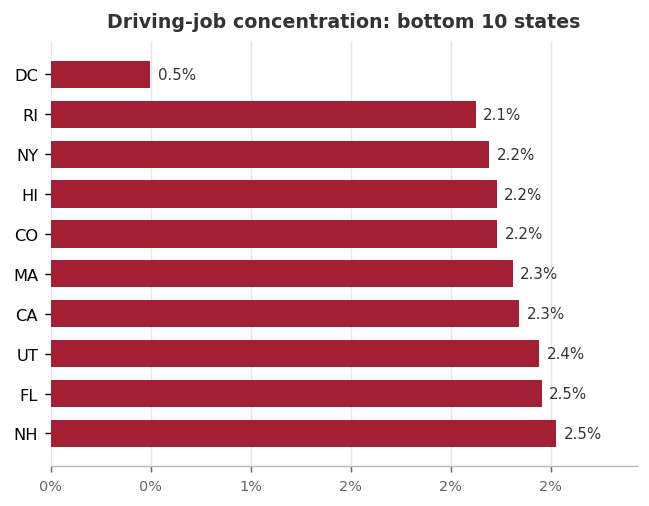
- Driving-job concentration (the seven driving occupations as a share of a state's total employment) runs from about 4.2% (North Dakota) down to about 2.1% (Rhode Island) among states; DC is an outlier at 0.5%.
- The most exposed states are rural and logistics-heavy: North Dakota, Arkansas, Wyoming, Iowa, and Tennessee, where trucking and distribution are a large share of local work.
- The least exposed are denser, transit-oriented economies (New York, Rhode Island, Hawaii), where driving is a smaller share of employment.
- The state spread is narrow (roughly 2.1% to 4.2%) compared with physical-AI exposure, because driving work is distributed more evenly than warehouse and factory jobs.
Exposure by Region
| Region | Driving jobs | Total employment | Concentration |
|---|---|---|---|
| Midwest | 1,015,610 | 32,988,610 | 3.1% |
| South | 1,656,420 | 58,399,780 | 2.8% |
| Northeast | 703,280 | 27,501,270 | 2.6% |
| West | 901,500 | 36,606,090 | 2.5% |
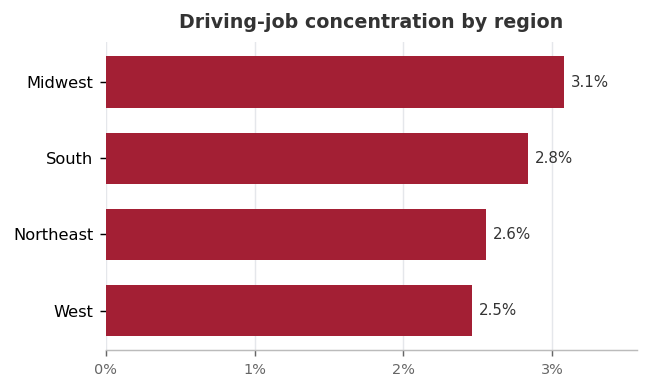
- Employment-weighted, the Midwest leads at 3.1%, followed by the South (2.8%), Northeast (2.6%), and West (2.5%).
- The regional spread is only about 0.6 points, reflecting how broadly distributed driving work is across the country.
- The South holds the largest absolute driving workforce (about 1.66 million jobs); the Midwest has the highest concentration.
US Driving Jobs Exposed to Vehicle Automation
| SOC | Occupation | US employment | % of US |
|---|---|---|---|
| 53-3032 | Heavy & Tractor-Trailer Truck Drivers | 2,062,050 | 1.33% |
| 53-3033 | Light Truck Drivers | 983,320 | 0.63% |
| 53-3031 | Driver/Sales Workers | 408,610 | 0.26% |
| 53-3051 | Bus Drivers, School | 402,960 | 0.26% |
| 53-3053 | Shuttle Drivers & Chauffeurs | 248,560 | 0.16% |
| 53-3052 | Bus Drivers, Transit & Intercity | 159,230 | 0.10% |
| 53-3054 | Taxi Drivers | 41,050 | 0.03% |
| Driving basket total | 4,305,780 | 2.77% |
- Rideshare jobs (primarily Uber and Lyft) are not included in official statistics because they are self-employed. Estimates of current rideshare jobs in the U.S. generally range from 1.5M to 2.5M.
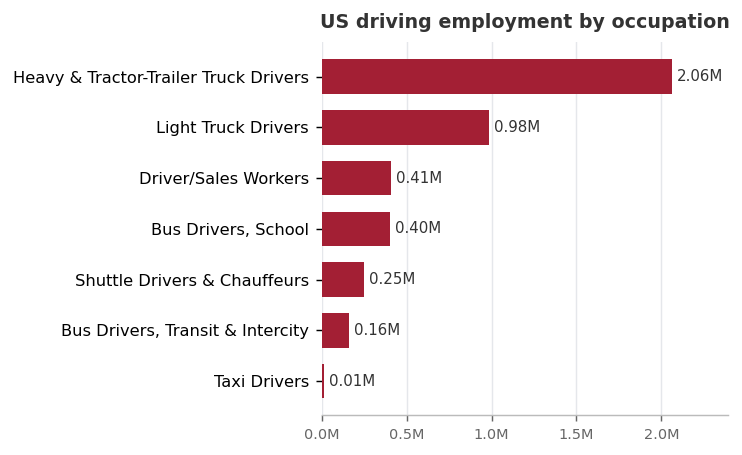
- The basket is seven motor-vehicle driving occupations totaling about 4.31 million jobs, roughly 2.8% of US employment.
- Heavy and tractor-trailer truck drivers (2.06M) and light truck drivers (0.98M) are together about 71% of the total; long-haul and delivery trucking dominate the exposure.
- Direct passenger-carrying work (taxi, shuttle drivers and chauffeurs) is about 0.29 million, under 7% of the basket, even though robotaxis are where automation is most visible today.
- The basket is a headcount proxy for potential exposure, not a forecast of which jobs automation will eliminate or when.
Sources
BLS OEWS, May 2025: state and national employment by detailed occupation and total all-occupations employment per state. bls.gov/oes
Occupation basket: seven motor-vehicle driving occupations (SOC 53-3031, 53-3032, 53-3033, 53-3051, 53-3052, 53-3053, 53-3054), matching the Automated Driving and Driving Jobs page.
Rideshare (Uber and Lyft) drivers are self-employed and not captured in OEWS. The 1.5 to 2.5 million range reflects published third-party and company estimates, not a BLS figure.
Companion workbook. technology-transportation-ai-cre-implications.xlsx: state-level driving-job exposure workbook (seven-occupation basket, state and regional concentration).