
- In the knowledge-work section, occupations could be assigned automation-exposure scores because software-AI capability is measurable against benchmarks (see Measuring AI Model Progress and the AI Exposure Explorer).
- Physical-AI capability, and its ability to replace human physical work, is still too nascent to support comparable scores, so this page does not score exposure.
- Total potential physical AI exposure by jobs: headcount in the four physical-task occupations that warehouse and factory robots most directly target (see below Top US Jobs with Physical AI Exposure).
- CRE42 will track and refine these measures as physical-AI deployment matures and the labor market adjusts and adapts (see What to Watch in 2026).
Exposure to Physical AI - Job Concentration by State
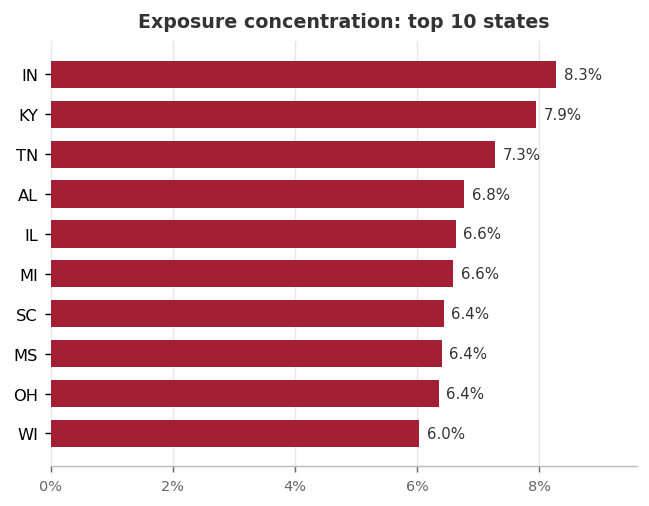
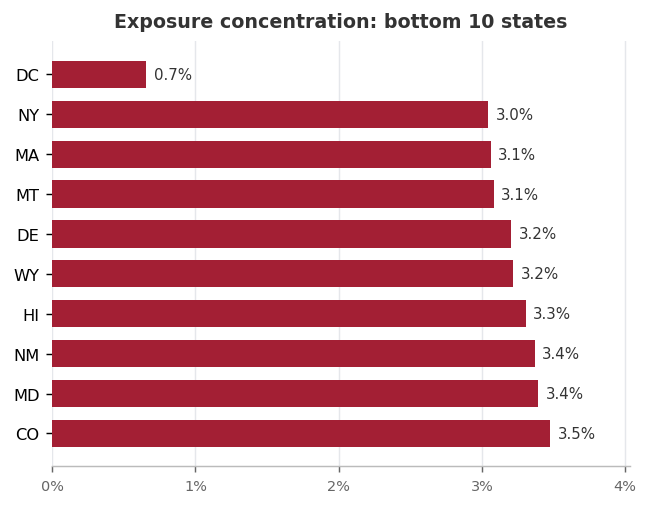
- Exposure concentration (basket jobs as a share of a state's total employment) peaks at 8.3% in Indiana and 7.9% in Kentucky; the most exposed states cluster in the industrial Midwest and South.
- The least exposed states sit near 3.0% (New York, Massachusetts), roughly one-third of the Indiana rate; the low end is a mix of coastal, service-oriented economies and small states.
- DC is an outlier at 0.7% and behaves as a city rather than a state economy.
- Concentration, not raw job count, is the local-risk measure: it captures how large a share of a state's workforce sits in these occupations.
Exposure by Region
| Region | Basket jobs | Total employment | Concentration |
|---|---|---|---|
| Midwest | 2,021,430 | 32,988,610 | 6.1% |
| South | 2,957,050 | 58,399,780 | 5.1% |
| West | 1,618,700 | 36,606,090 | 4.4% |
| Northeast | 1,151,830 | 27,501,270 | 4.2% |
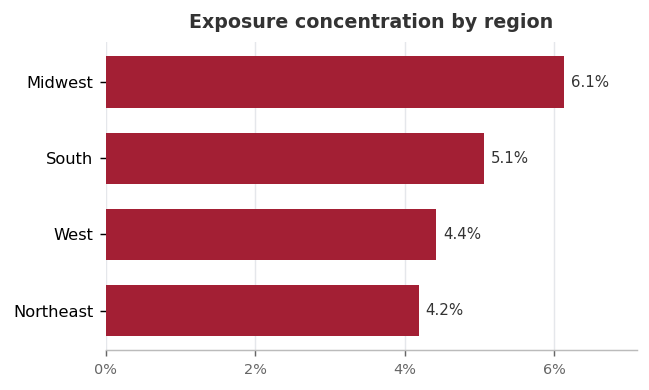
- Employment-weighted, the Midwest is the most exposed region at 6.1%, ahead of the South (5.1%), West (4.4%), and Northeast (4.2%).
- The 1.9-point Midwest-to-Northeast gap tracks the manufacturing-heavy interior against the service-oriented coasts.
- The South holds the largest absolute exposed workforce (about 2.96 million basket jobs) but at lower concentration than the smaller Midwest base.
Top US Occupations with Projected Physical AI Exposure
| SOC | Occupation | Group | US employment | % of US |
|---|---|---|---|---|
| 53-7062 | Laborers & freight, stock, material movers | Warehouse | 2,950,300 | 1.9% |
| 53-7065 | Stockers & order fillers | Warehouse | 2,833,790 | 1.8% |
| 51-2090 | Assemblers & fabricators | Manufacturing | 1,405,050 | 0.9% |
| 53-7064 | Packers & packagers, hand | Warehouse | 559,870 | 0.4% |
| Basket total | 7,749,010 | 5.0% |
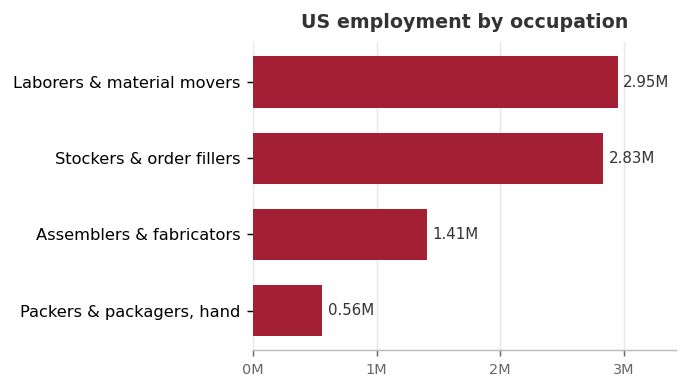
- The basket is four occupations: laborers and material movers (2.95M), stockers and order fillers (2.83M), assemblers and fabricators (1.41M), and hand packers (0.56M).
- Together about 7.75 million jobs, roughly 5.0% of US employment (155.5M).
- Warehouse-type roles account for three of the four categories; assemblers and fabricators are the one factory-floor group.
- The basket is a transparent headcount proxy for exposure, not a task-level forecast of which jobs automation will eliminate.
Manufacturing Intensity by State
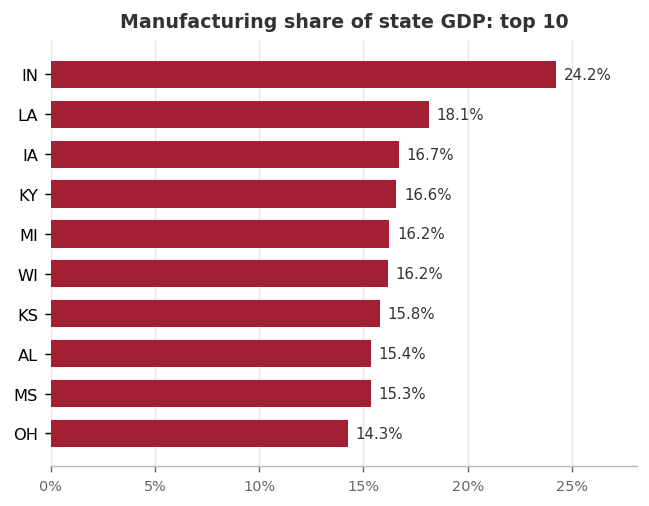
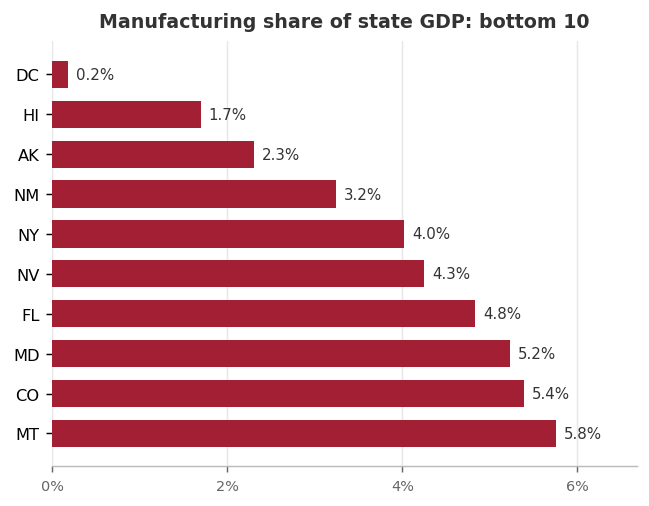
- Manufacturing's share of state GDP is the strongest available predictor of exposure concentration (r = +0.77).
- The most manufacturing-intensive states (Indiana at 24%, then Louisiana, Iowa, Kentucky, Michigan) are largely the same states that top the exposure ranking.
- Louisiana is the main exception: its high manufacturing share reflects capital-intensive petrochemicals, so its job concentration is lower than manufacturing GDP alone would suggest.
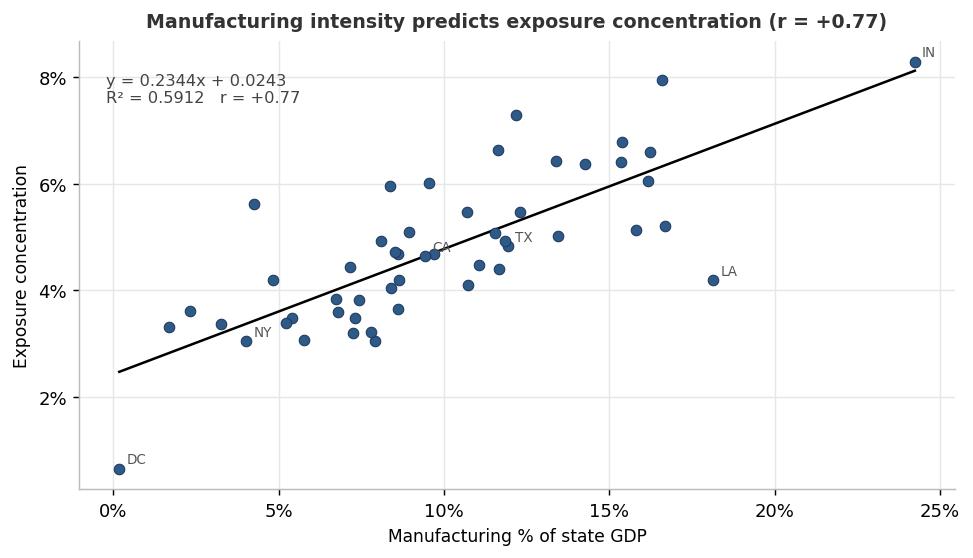
Each point is a state. Manufacturing % of state GDP (x) vs. exposure concentration (y). | Chart: CRE42
Sources
BLS OEWS, May 2025: state and national employment by detailed occupation and total employment. bls.gov/oes
BEA, GDP by State, Table SAGDP2, 2024 (current-dollar): manufacturing and total state GDP. apps.bea.gov
US Census Bureau, state population estimates (via CRE42 demographics workbook).
Companion workbook. technology-physical-ai-cre-implications.xlsx: state-level physical-automation exposure workbook (occupation basket, state and regional concentration, and manufacturing-intensity analysis).