Data: CoStar market data, March 2026; Green Street, May 2026; FRED (CPI, construction PPI).
This page covers market fundamentals behind the current industrial real estate cycle: rent and occupancy, revenue growth, the supply wave, values and construction costs. All figures are national market data (CoStar, Green Street), not REIT-specific. General patterns are consistent with the CRE42 REIT composite metrics (previous page): rising demand and construction costs have led to consistent (although diminishing) revenue gains through the cycle, leading to increased construction and ultimately increased vacancy. Persistently high interest rates and construction costs have now combined with increased vacancy to reduce the construction pipeline as overbuilt U.S. markets (primarily in the south) enter the absorption and stabilization phase of the cycle, although at varying rates.
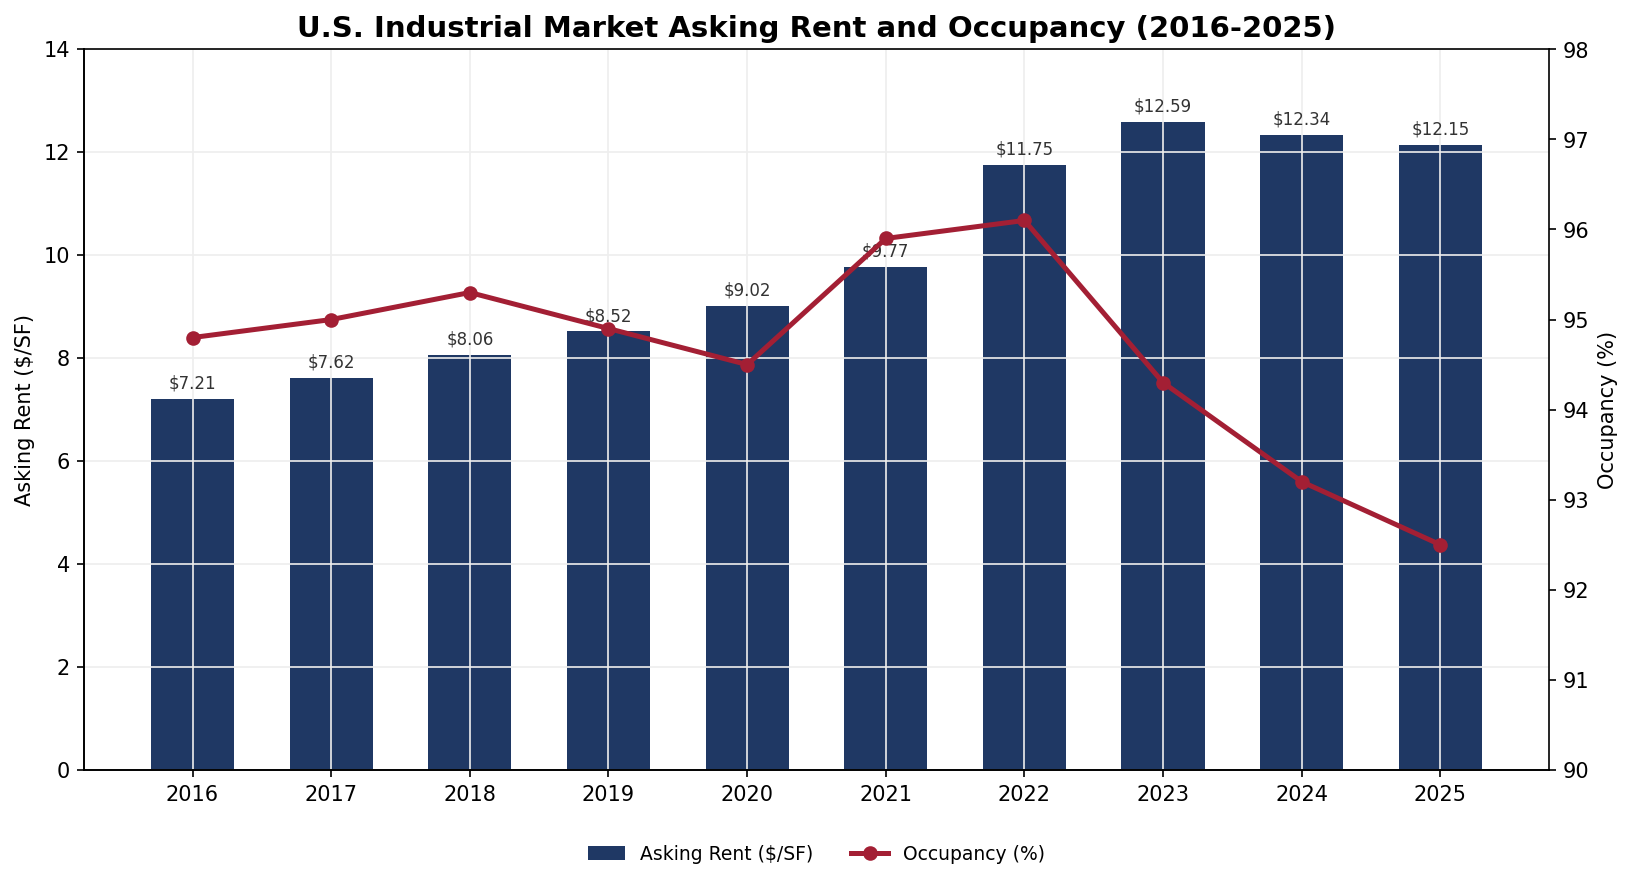
Market Asking Rent and Occupancy (2016–2025)
Source: CoStar, March 2026.
Asking rent rose from $7.21/SF in 2016 to $12.15 in 2025, a 69% increase, with positive growth in every year of the decade.
Occupancy peaked at 96.1% in 2022 (a record-low 3.9% vacancy), then fell to 92.5% by 2025 as the supply wave delivered.
Rent and occupancy diverged after 2022. Asking rents kept rising even as occupancy fell roughly 360 basis points, though annual rent growth decelerated from 10.0% in 2022 to 2.0% in 2025.
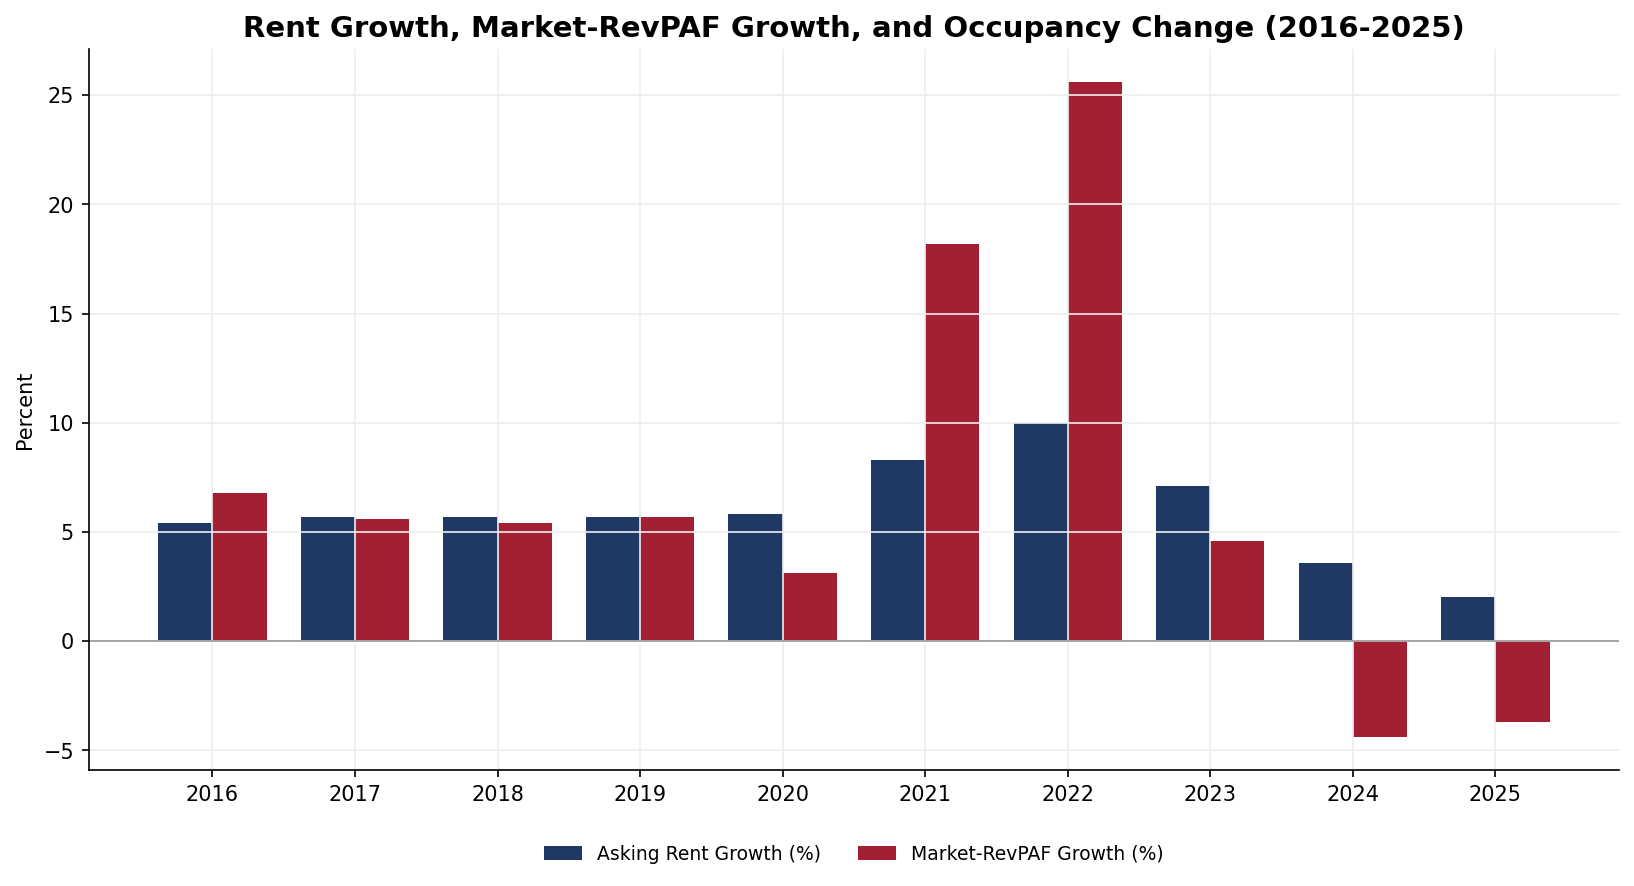
Rent Growth, Occupancy Change, and Market Revenue (2016–2025)
Sources: CoStar, March 2026; Green Street, May 2026.
Asking rent growth held at 5.4–5.9% per year from 2016 through 2020, then accelerated to 8.3% in 2021 and a decade-peak 10.0% in 2022 before slowing to 2.0% in 2025.
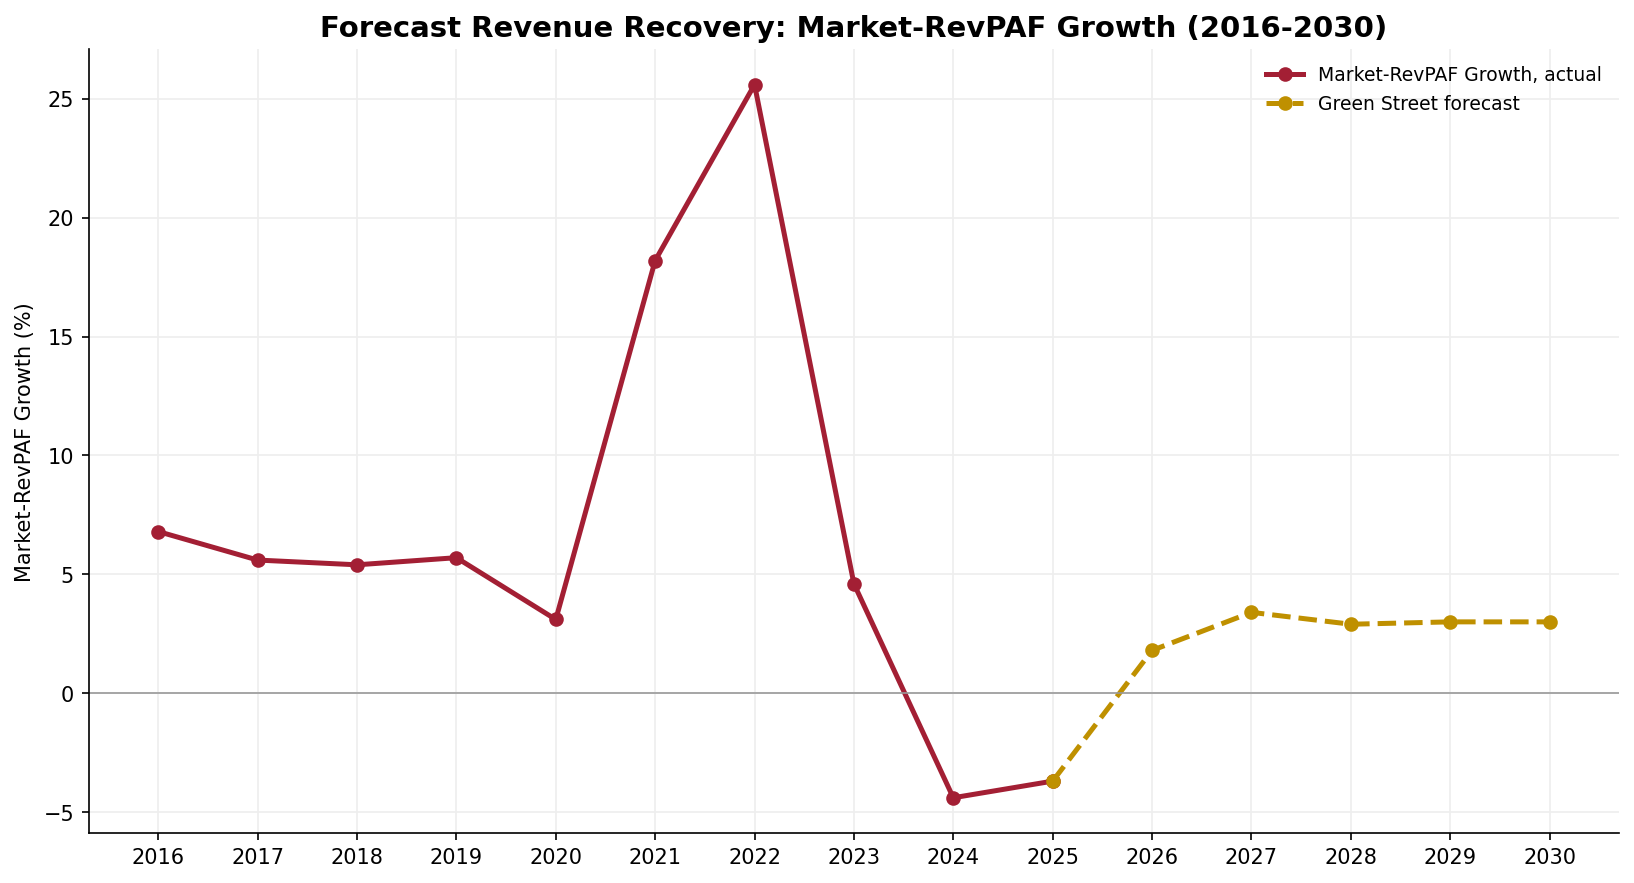
Market-RevPAF growth (rent times occupancy) spiked to 18.2% in 2021 and 25.6% in 2022, then turned negative: -4.4% in 2024 and -3.7% in 2025, the only negative years in the window.
The swing from the 2022 peak to the 2024 trough is roughly 30 percentage points, the sharpest revenue reversal in the dataset.
Occupancy change tells the same story in levels: gains through 2022 (+1.3 pp in 2021), declines from 2023 through 2025 (-1.8 pp in 2023 alone).
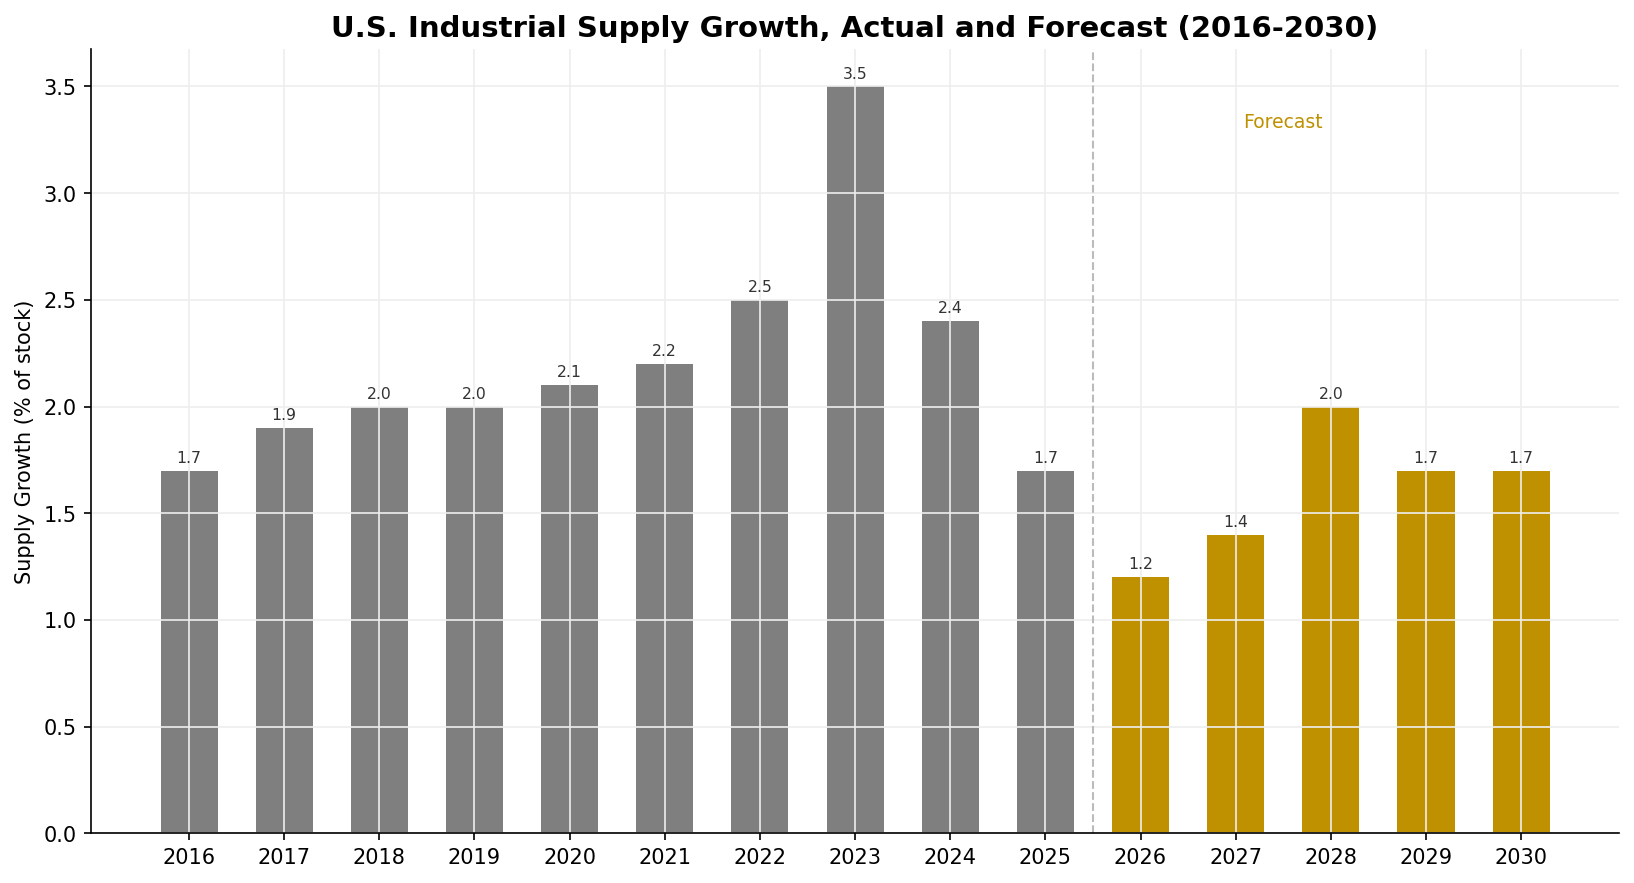
Supply Growth, Actual and Forecast (2016–2030)
Source: Green Street, May 2026. 2026–2030 bars are Green Street forecasts.
Supply growth roughly doubled from its pre-pandemic pace, rising from 1.7–2.1% of stock in 2016–2020 to a peak of 3.5% in 2023.
The wave reversed quickly: 2.4% in 2024 and 1.7% in 2025, back to the 2016 pace.
Green Street forecasts a trough of 1.2% in 2026, with supply growth staying at or below 2.0% of stock through 2030.
The pattern matches CoStar deliveries data: a record 516 million SF delivered in 2023, falling to 256 million SF in 2025.
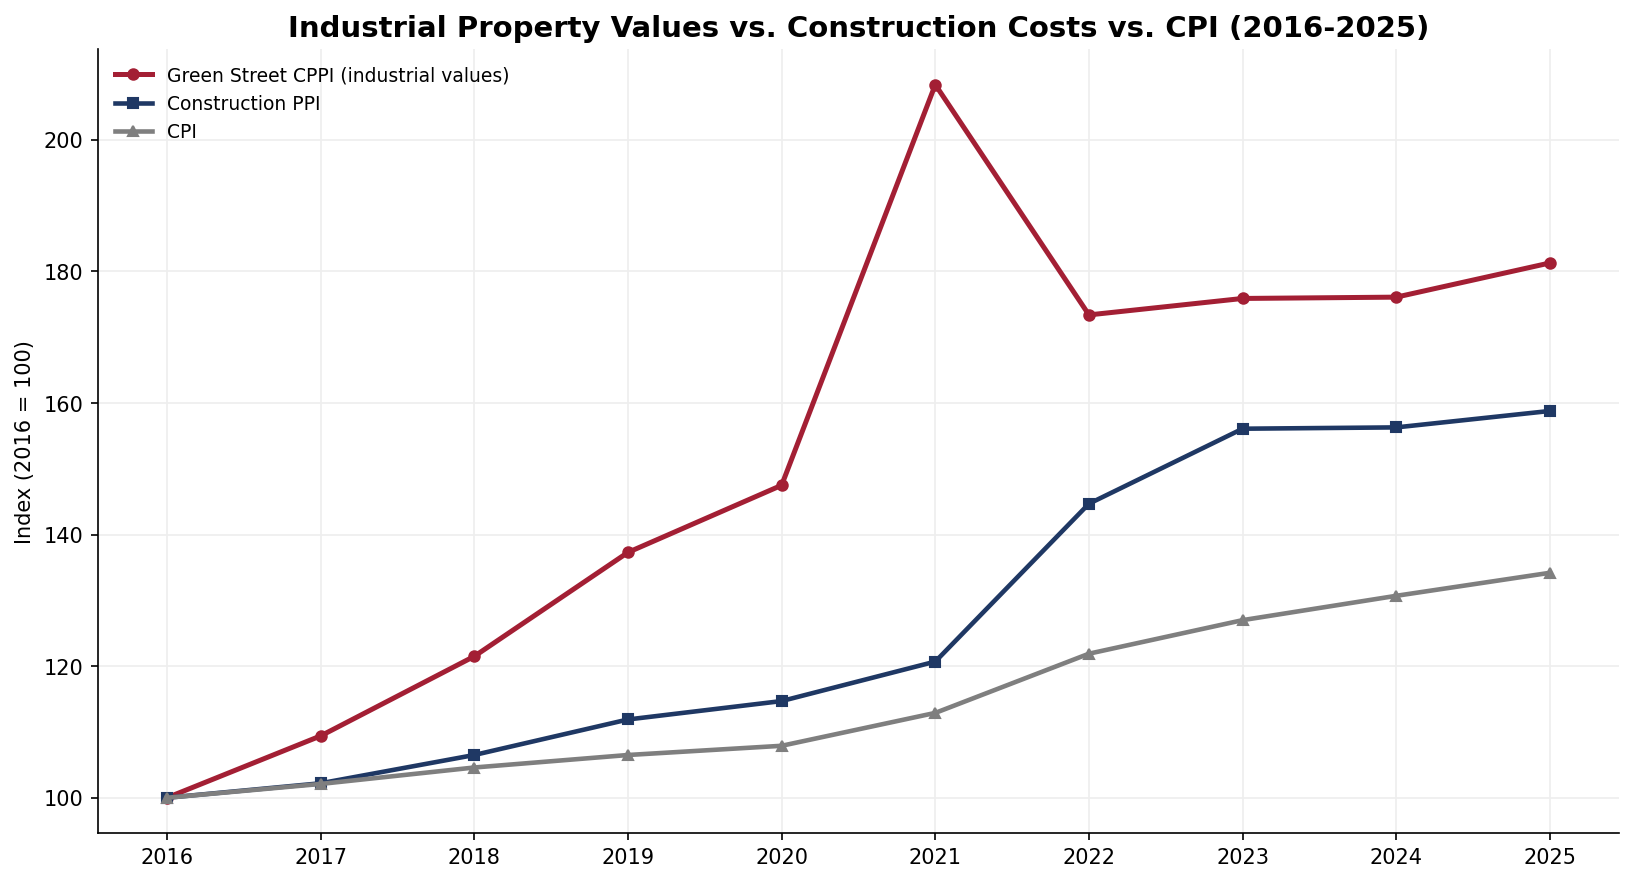
Property Values vs. Construction Costs vs. CPI (2016–2025)
Sources: Green Street CPPI, May 2026; FRED series WPU801 (construction PPI) and CPIAUCSL (CPI). All series indexed to 2016 = 100.
Industrial property values more than doubled from 2016 to 2021 (Green Street CPPI: 100 to 208), then corrected 17% in 2022 and have been roughly flat since (181 in 2025).
Construction costs rose 59% over the decade, with most of the increase concentrated in 2021–2023; costs have not given back their gains.
CPI rose 34% over the same period, meaning construction costs outpaced general inflation by roughly 25 points.
Even after the 2022 correction, values remain well above cost inflation: +81% since 2016 vs. +59% for construction costs.