
Robotaxi Deployment
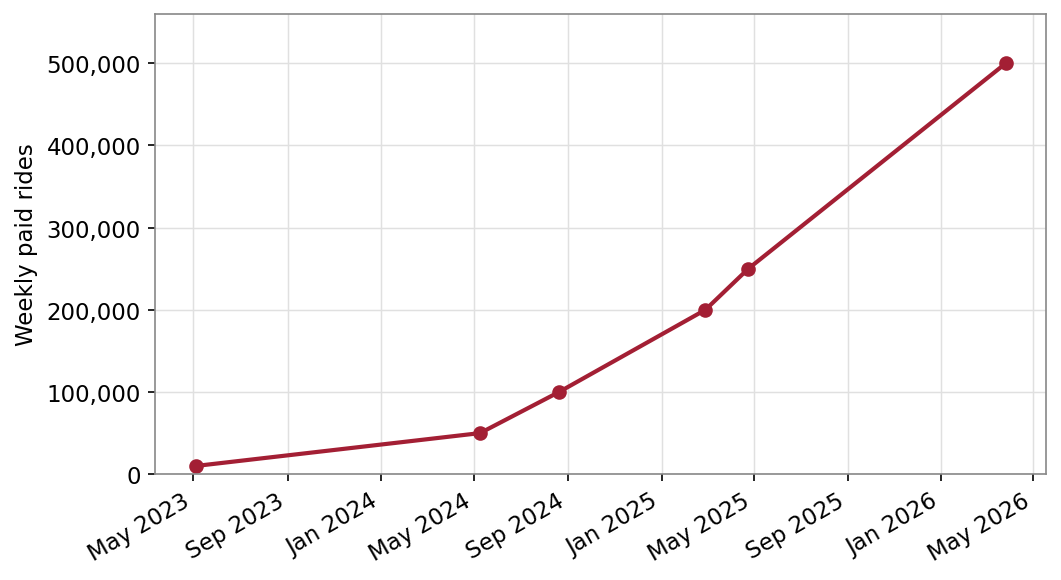
Waymo weekly paid robotaxi rides, disclosed milestones through the most recent available (March 2026) | Source: Waymo / Alphabet company disclosures. Dotted line: stated year-end 2026 target.
Waymo’s weekly paid-ride count is the clearest single measure of robotaxi scaling. The disclosed milestone series runs from roughly 10,000 weekly rides in May 2023 to 500,000 by late March 2026, the most recent milestone Waymo has published; at its September 1, 2026 expansion to Denver, San Diego and Tampa the company still described volume as more than 500,000 paid trips a week, with the fleet now above 4,000 vehicles (about 300 of them the new sixth-generation Ojai) and, as of March, more than four million autonomous miles per week.[3]
Tesla’s footprint illustrates the recurring gap between announced coverage and deployed scale. Its Q2 2026 Update (July 2026) lists six metros “ramping unsupervised” after Miami, Orlando and Tampa were added in July, two more in preparation, and the Bay Area still operating with a safety driver; cumulative paid robotaxi miles reached roughly 2.4 million by June 2026, and Tesla separately reported more than 380,000 unsupervised miles. Cybercab production began at Giga Texas during the quarter.[4]
Robotaxis achieved significant scale during 2025. Waymo reported 500,000 paid rides per week by late March 2026, roughly a tenfold increase in under two years, against a stated year-end 2026 target of one million weekly rides, and by September 2026 offered paid public service in 14 U.S. metros.[1] Tesla robotaxis now provide unsupervised rides in six Texas and Florida metros, and Zoox began charging for driverless rides in Las Vegas in August 2026. All three have significant expansion plans for 2026 and beyond.
Autonomous trucking reached commercial driverless operation in 2025 but remains in the early stages of commercialization. The two public pure-plays, Aurora Innovation and Kodiak AI, together reported about $5.5 million in combined second-quarter 2026 revenue.[2] While the revenue remains small, Aurora had stacked up nearly 440,000 driverless miles by the end of June 2026 and Kodiak passed 40,000 paid driverless hours.
Key Observations
- Robotaxi ride volume is compounding fast; autonomous trucking is real but tiny in revenue terms.
- Every commercial U.S. deployment (both AV taxis and trucks) but one sits in Sun Belt states (TX, AZ, FL, GA, NV, TN, CA), driven by regulatory permissiveness and weather; Waymo’s Denver launch in September 2026 is the first exception.
- On a benchmark-matched basis, Waymo reports materially lower crash rates than human drivers in the same cities; the comparison is operator-conducted and peer-reviewed, but not independently replicated.
- Announced coverage consistently runs ahead of deployed fleet size, most visibly for Tesla.
Autonomous Trucking
Aurora Innovation operates hub-to-hub on the Texas triangle (Dallas–Houston–El Paso–Phoenix); Kodiak AI operates primarily off-highway in the Permian Basin.
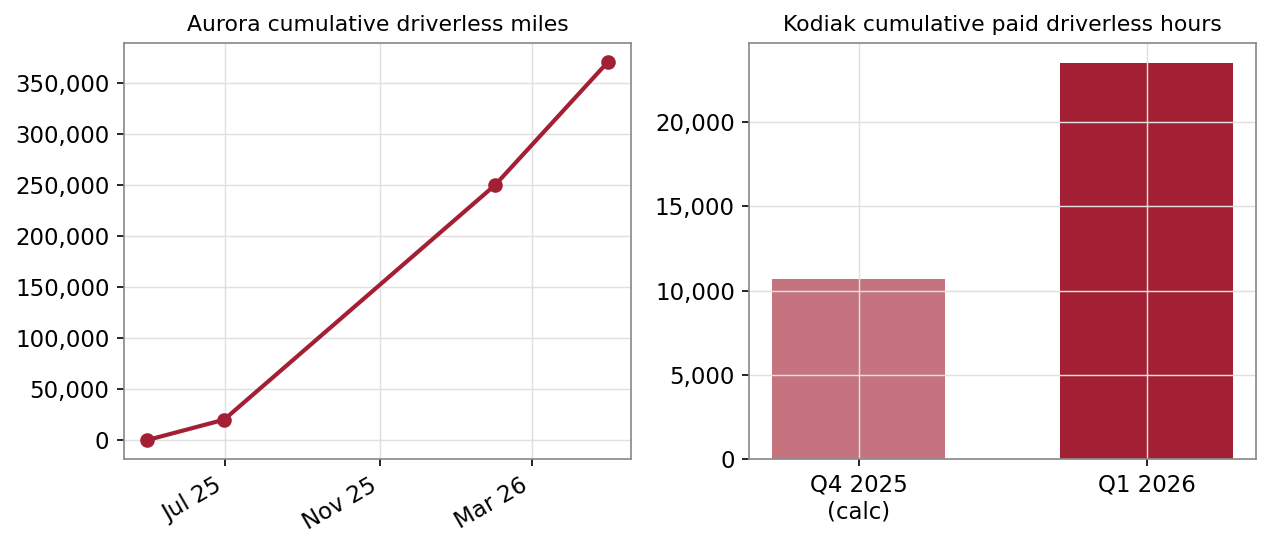
Autonomous trucking operating metrics | Sources: Aurora Innovation and Kodiak AI shareholder letters and results through Q2 2026, SEC 8-K Exhibit 99.1. Kodiak Q4 2025 hours derived from stated QoQ growth.
Safety
On a benchmark-matched basis, Waymo’s reported crash rates per 100 million vehicle miles sit far below the matched human benchmark across all three severity categories.
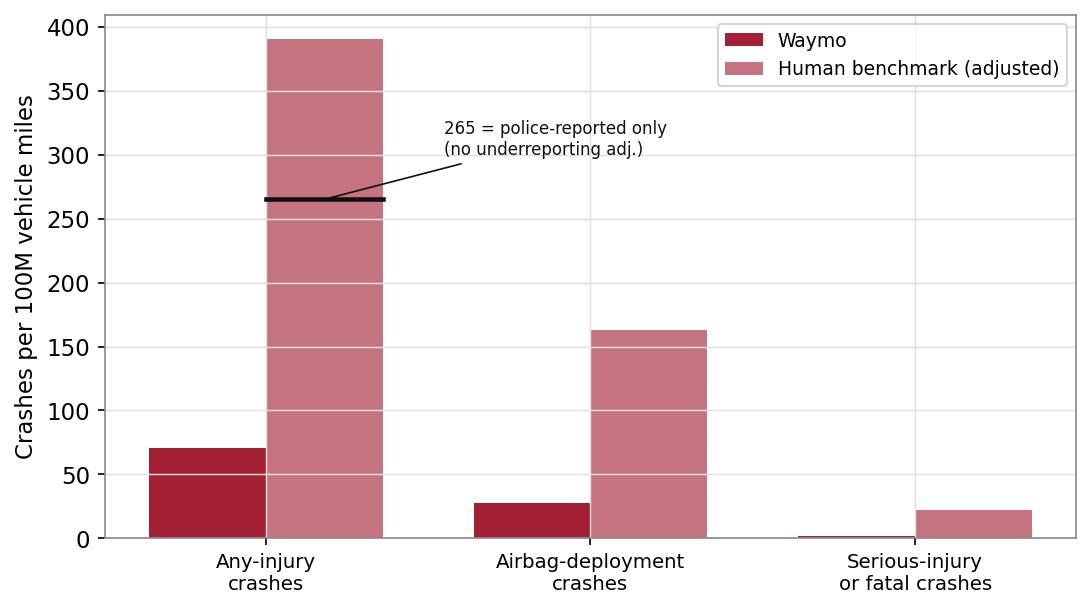
Crash rates per 100M vehicle miles, Waymo Rider-Only vs matched human benchmark, all locations, 220.6M driverless miles through March 2026 | Source: Waymo Safety Hub (incidents per million miles × 100). The 266 marker shows the any-injury human rate without the 32% underreporting correction.[6]
On 220.6 million fully driverless miles through March 2026, Waymo reports 94% fewer crashes with serious injury or worse, 82% fewer airbag-deployment crashes, and 82% fewer any-injury crashes than matched human drivers, along with 93% fewer pedestrian and 84% fewer cyclist injury crashes.[5] The any-injury human benchmark includes a 32% upward correction for crashes that never reach police records; even without that correction, the human rate (266 per 100M VMT) remains far above Waymo’s (71). These are surface-street rates in Waymo’s operating cities, distinct from national figures, and the analysis is Waymo-conducted, peer-reviewed, but not independently replicated.
The record is not incident-free. Between April 11 and May 18, 2026, Waymo identified 13 events in which its vehicles entered freeway sections closed for construction, and it restricted freeway driving across its network from May 19. NHTSA recall 26E035, filed June 17, 2026, covered 3,871 vehicles with a software remedy for construction-zone detection and routing. Freeway service resumed gradually from July 29, starting in Phoenix.[7]
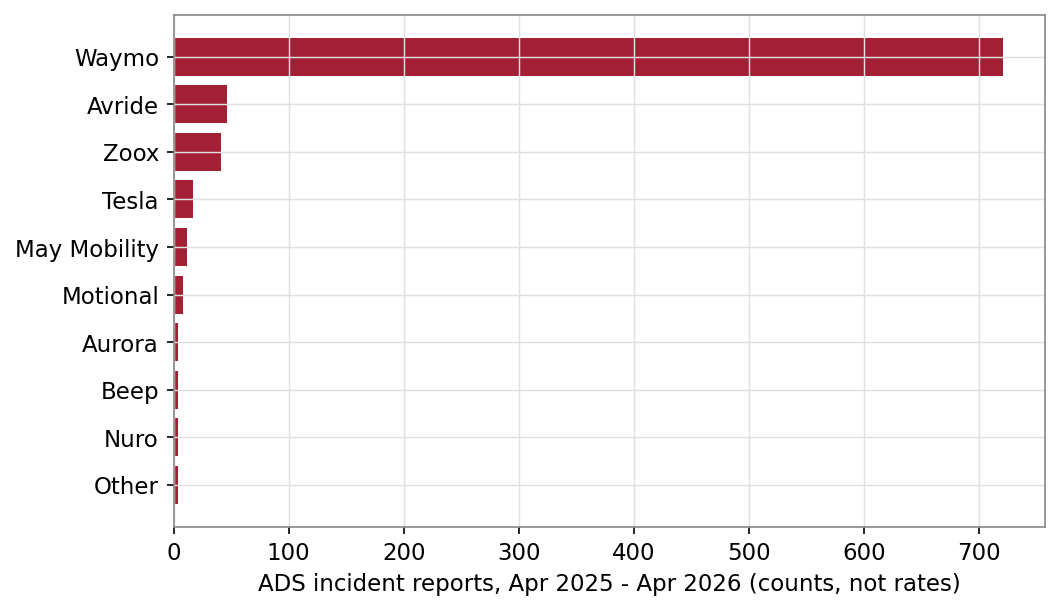
NHTSA Standing General Order ADS incident reports by entity, Aug 2025 – Jul 2026 (1,299 unique incidents; 1,095 property damage only, one fatality) | Source: NHTSA SGO-2021-01, current release. Counts, not rates: entities differ enormously in fleet size and miles driven.
Stated Company Targets
The figures below are company-stated forward targets from the sources noted, not independent forecasts.
What to Watch in 2026
- Whether Waymo closes the gap from 500,000 to one million weekly rides by December and lights up its remaining announced metros (DC, Las Vegas, Detroit) and London.
- Tesla’s progress closing the gap between announced robotaxi coverage and deployed unsupervised fleet, and whether Cybercab moves beyond Austin.
- Aurora’s second-generation truck count at the end of Q3, its path to 200 driverless trucks, and whether Q4 revenue delivers the back-half-weighted FY2026 guidance.
- Kodiak’s long-haul public-highway driverless launch, targeted by year-end 2026.
- Any NHTSA, CA DMV, or CPUC action that changes the regulatory cadence; whether independent researchers replicate the safety analyses.
Sources
[1] Waymo / Alphabet company disclosures (blog, X posts, executive interviews), 2023–2026. 500,000 weekly paid rides reported late March 2026; one-million-ride target stated by co-CEOs, Feb 2026; 14 U.S. metros with paid public service and “more than 500,000 paid trips a week” per Waymo at the Sept 1, 2026 launches in Denver, San Diego and Tampa, as reported by TechCrunch and Bloomberg. ↩
[2] Aurora Innovation Q2 2026 Shareholder Letter (July 29, 2026) and Kodiak AI Q2 2026 Results (August 6, 2026), SEC 8-K Exhibit 99.1: Aurora revenue $2 million, Kodiak $3.5 million. Kodiak’s reported Q2 net income of $12.5 million reflects a $58.3 million non-cash gain on warrant fair value; its operating loss was about $44 million. Heavy and tractor-trailer driver employment per BLS OEWS. ↩
[3] Waymo Year in Review (Dec 2025) and co-CEO interview (Mar 2026): >4M autonomous miles/week, 20M+ lifetime paid rides. Fleet “more than 4,000 vehicles” and about 300 Ojai per Waymo’s September 1, 2026 expansion announcement (TechCrunch, Electrek); the fleet was about 3,000 from December 2025 to March 2026. ↩
[4] Tesla Q2 2026 Update (July 22, 2026): status labels verbatim; the deck charts cumulative paid robotaxi miles without stating the figure, which reads as roughly 2.4 million through June 2026. The 380,000-plus unsupervised miles figure is a Tesla statement of July 22, 2026. Independent analysts note that quarterly paid-mile growth flattened in Q2 2026. ↩
[5] Waymo Safety Hub, “All Locations” incidents per million miles, data through March 2026 (update of June 24, 2026; verified September 2026): any-injury 0.71 vs 3.91, airbag deployment 0.30 vs 1.68, serious injury or worse 0.01 vs 0.23; peer-reviewed companion: Kusano et al., Traffic Injury Prevention (2025). Underreporting correction per Blincoe et al. (2023), “The Economic and Societal Impact of Motor Vehicle Crashes, 2019 (Revised),” NHTSA Report DOT HS 813 403. National fatality context: NHTSA annual data (1.19 per 100M VMT, 2024). ↩
[6] The raw incident counts reported to NHTSA cannot be divided by miles and compared to human crash statistics. The Standing General Order captures essentially every contact event via telematics, while human benchmarks capture only police-reported crashes, which miss a large share of minor contacts. The valid comparison is benchmark-matched: same cities, same road types, with an underreporting correction applied to the human injury side. ↩
[7] NHTSA Part 573 safety recall report 26E035 (Waymo LLC, submitted June 17, 2026): 3,871 vehicles; 13 events on April 11, April 19 and May 18, 2026; freeway restrictions from May 19; recall decision June 8. Resumption per Waymo statement of July 29, 2026, as reported by TechCrunch. ↩
Companion workbook. technology-transportation-ai.xlsx: Robotaxi ride growth, deployment by metro, AV trucking metrics (Aurora & Kodiak), safety rate comparison, NHTSA ADS incident summary, driving occupations, company targets, CRE implications map