
Measuring Physical AI Progress: Early Milestones and Task Benchmark Results
There is no standard scoreboard for humanoid robots. Software AI has benchmark suites such as MMLU and GPQA and independent aggregators that test every major model the week it ships. Nothing comparable exists for physical AI: testing a robot requires possessing the hardware, a lab, and weeks of work per platform, and most leading humanoids are not for sale. The result is that after four years and tens of billions of dollars of investment, the first independent measurement efforts all appeared within a six-week window in May and June 2026, and as of September 2026 none has yet published results for more than one robot. The field today resembles LLM benchmarking circa 2020, before standard leaderboards existed: capability claims are press releases and demonstration videos, and apples-to-apples comparison across robots is not yet possible.
The individual measured results that do exist are presented below as standalone data points, each with its own source and test conditions. They should not be combined into a single comparison.
Robotics & Physical AI: Binding Constraints[6]
Why is physical AI years behind software AI? The constraints are not primarily computational; the same GPU clusters that train language models can train robot policies. The constraints are physical and institutional, and they cluster around three core problems.
- Bipedal locomotion on structured surfaces (factory floors, flat warehouses) is largely solved; Boston Dynamics’ Atlas can run, jump, and perform dynamic maneuvers, and multiple commercial platforms navigate indoor environments reliably.
- Pattern recognition and perception in controlled settings have improved dramatically through foundation models like RT-2 and π0, enabling robots to identify and interact with novel objects without explicit programming.
- Communication between robots and human operators through natural language is functional, powered by the same LLM architectures that drive ChatGPT and Claude.
The unsolved problems are primarily about physical interaction with unpredictable environments, the domain where the real world is most different from the digital one (see LLMs, World Models, and VLA Models above).
Market Forecasts and Timeline Estimates
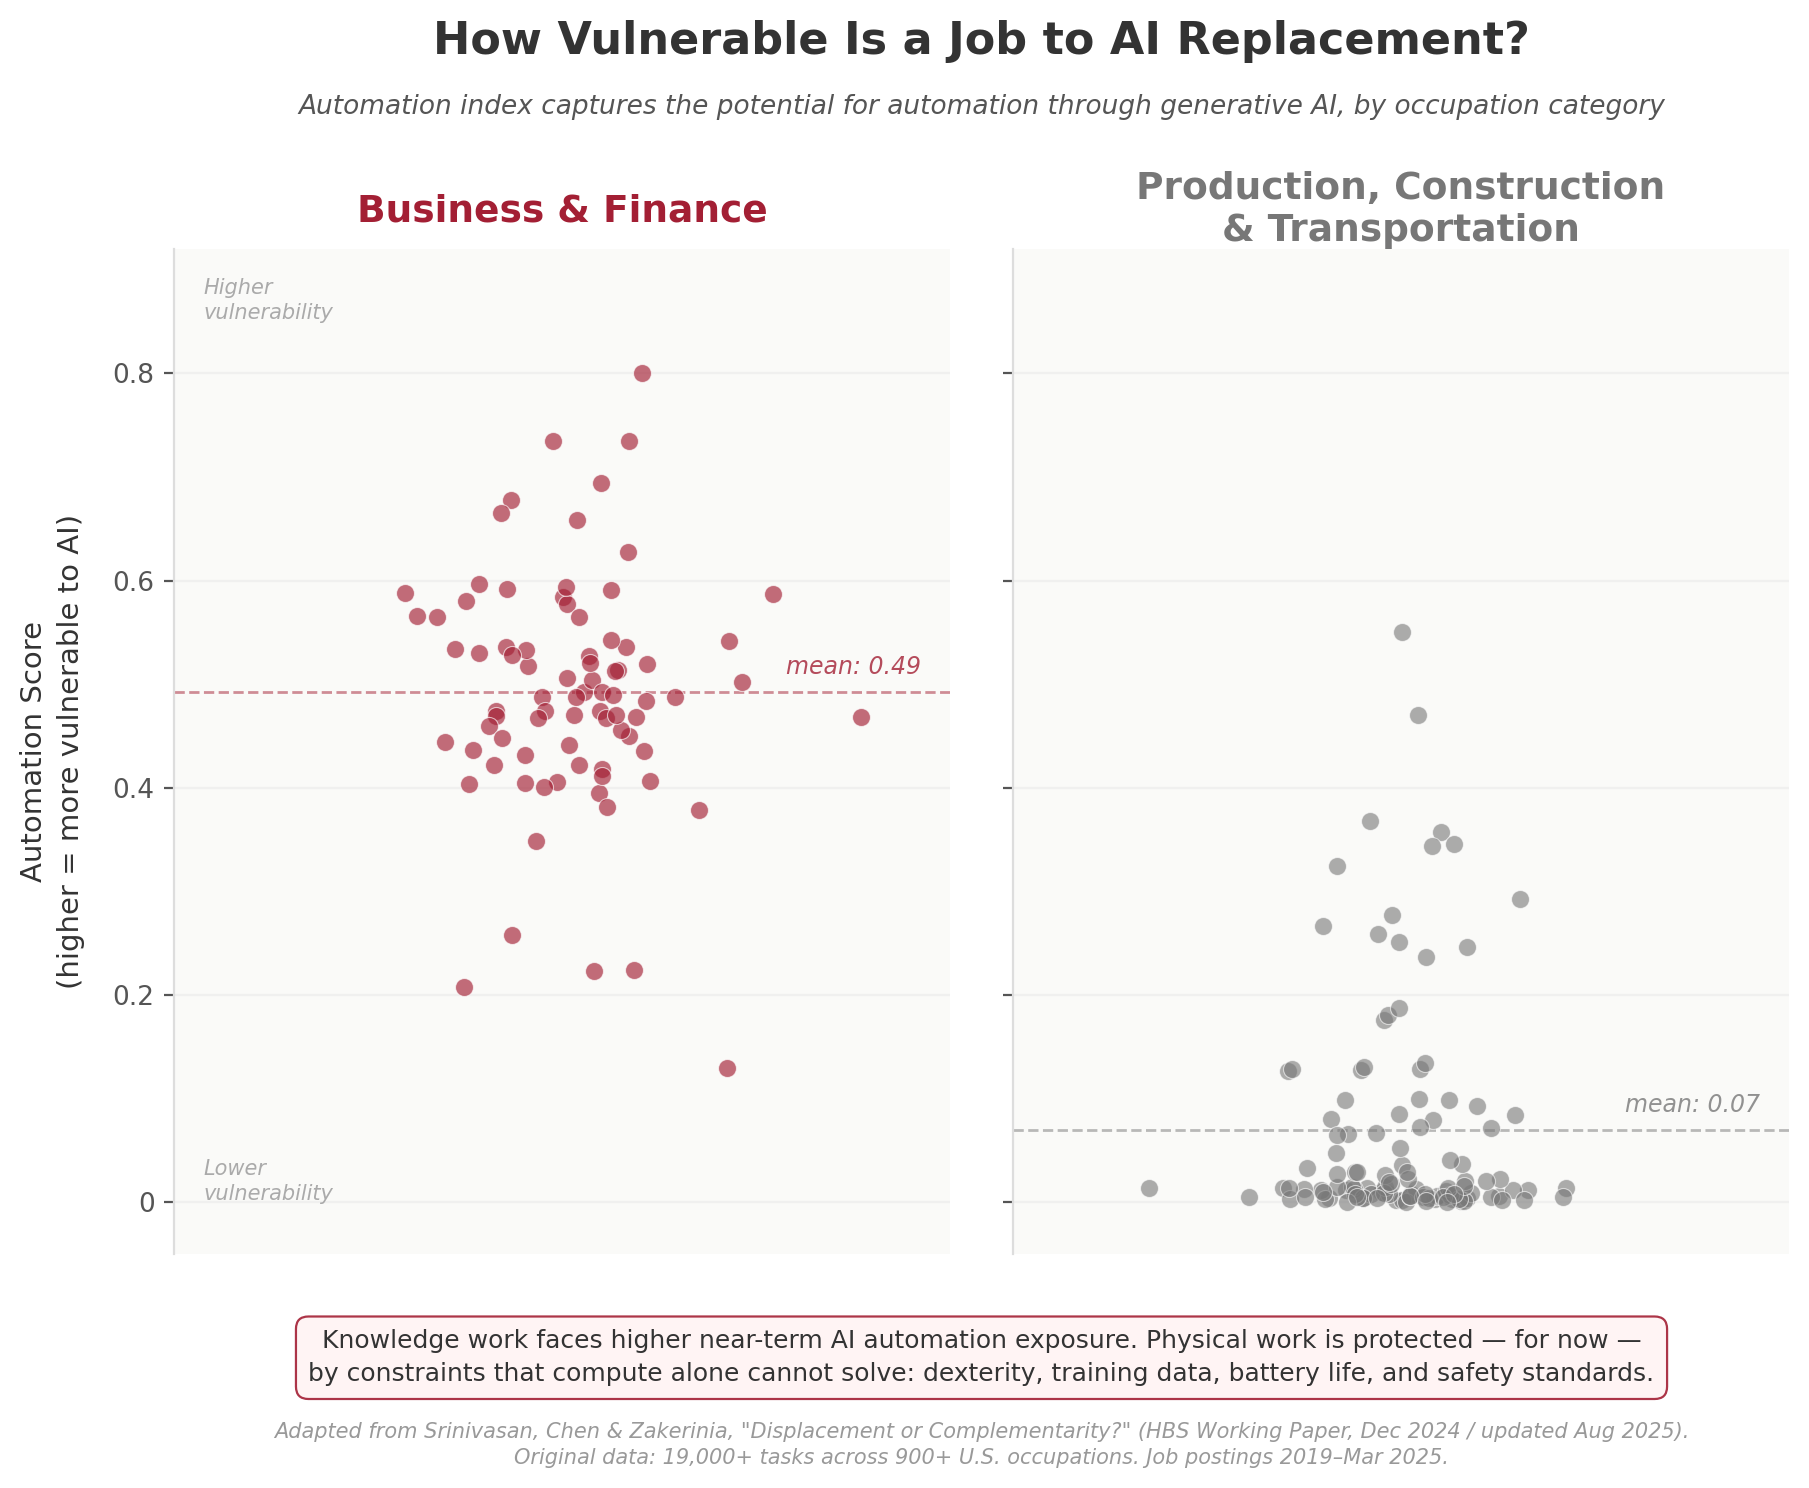
AI Automation Vulnerability by Occupation Category | Adapted from Srinivasan, Chen & Zakerinia, “Displacement or Complementarity? The Labor Market Impact of Generative AI” (HBS Working Paper, Dec 2024 / updated Aug 2025). Original data: 19,000+ tasks across 900+ U.S. occupations scored using OpenAI ChatGPT. Job postings 2019–Mar 2025.
Knowledge work appears to be more exposed to AI automation than physical work based on currently available technology. An HBS study scoring 19,000+ tasks across 900+ U.S. occupations found that business and finance roles average 0.49 on its automation index, while production, construction, and transportation roles average 0.07.[7] The reason is the set of physical constraints described above: dexterity, training data, battery life, safety standards, and maintenance infrastructure.
The chart above illustrates the high potential exposure business and finance jobs have to AI based automation compared to the much lower current exposure levels for more physically focused jobs in the production, construction, and transportation sectors.
What the HBS score does and does not measure. The study scores each occupation’s tasks on whether generative AI software can perform them. A model’s outputs are text, code, images, and analysis, so a task like preparing financial statements scores high, while a task like laying a weld bead scores near zero: no software output can actuate in the physical world. The score is therefore a faithful measure of software exposure, not a general measure of automation risk. Three occupations make the distinction concrete. Welders score 0.04 on the HBS index despite being the most thoroughly automated occupation of the twentieth century, with robotic arms welding in every major auto plant since the 1980s. Industrial truck operators score 0.00 while automated guided vehicles displace forklift drivers in warehouses today. Stockers and order fillers score 0.33, well above welders, because the index detects the clerical fraction of their work, the inventory records and scheduling, not the physical picking.
This is Moravec’s Paradox in a 2025 dataset: tasks humans find hard, such as tax analysis, are easy for AI, while tasks a toddler finds easy, such as picking up an oddly shaped object, remain hard for machines. The software wave and the physical wave are different technologies on different timelines. This page covers the second one, and the constraints and measurements above describe where it actually stands.
Select Estimates and Projections – Robotics and Physical AI Automation
| Source | What They Estimate | Market / Shipment Figures | Labor Impact Estimate | Horizon | Key Caveat |
|---|---|---|---|---|---|
| HBS (Srinivasan et al., Dec 2024 / Aug 2025) | AI automation vulnerability by occupation (19,000+ tasks, 900+ occupations) | N/A | Post-ChatGPT: automation-prone job postings −13%; augmentation-prone postings +20%. Business & finance automation score: 0.49 mean. Production/construction/transport: 0.07 mean. | 2019–Mar 2025 | Empirical observation, not forecast. Measures actual job posting changes. Focuses on generative AI (software), not physical robotics. Physical work scores near zero because the technology to automate it at scale doesn’t exist yet. |
| iCapital / Multi-Bank Consensus (Aug 2025) | Humanoid adoption & TAM (average of BofA, Citi, Morgan Stanley, UBS base cases) | TAM ~$4.5T by 2050; ~1M units by 2030; ~25M by 2035; ~800M by 2050. BoM ~$40K by 2026, ~$10K by 2040. | 5 in 10 U.S. manufacturing positions expected vacant through 2033; China faces 22% labor force decline by 2050. Humanoids could boost manufacturing efficiency 20–30% in 5 years. | 2025–2050 | Consensus average across four major banks. Three adoption phases: industrial (2025–2030), services & healthcare (2031–2035), household/societal (2036+). VC: $3.1B in H1 2025 > $2.9B entire 2010–2024 period. ~10% U.S. household adoption by 2050. |
| Goldman Sachs (Jan 2024 + Mar 2026) | Humanoid robot market; AI labor impact | $38B market by 2035; 250K+ units by 2030; 1.4M units by 2035; 70% CAGR | 6–7% of U.S. workers displaced over ~10 years; AI can automate 25% of U.S. work hours; 0.6pp unemployment increase if adoption spread over a decade[8] | 2024–2035 | Market estimate revised 6× upward from prior $6B estimate after costs declined 40%. Mar 2026 update: displaced knowledge workers may be poorly suited for the labor most needed (HVAC, electricians, construction). Data center build-out has already created 216,000 construction jobs since 2022. |
| Morgan Stanley (Apr 2025) | Total humanoid ecosystem (hardware + supply chain + services) | $5T by 2050; 1B+ units; 13M units by 2035 | U.S.: 8M humanoid workers by 2040 ($357B wage impact); 63M by 2050 ($3T payroll, 75% of occupations, 40% of employees affected) | 2025–2050 | 25-year forecast. Adoption “relatively slow” until 2035, then accelerating. $5T includes entire ecosystem. Consumer home applications a decade away. 10% of U.S. households may own a humanoid by 2050. |
| IFR (Sep 2025; preliminary 2025 results Jun 2026) | Industrial robots (all types, not just humanoid) | 621K installs in 2025 (preliminary, +15%, a record); 542K in 2024; 4.66M operational stock (end 2024); 700K+ projected by 2028 | N/A: IFR reports installations, not labor impact | Actual through 2025 (preliminary) | Measured, not forecasted. Humanoids are about 3% of annual volume. This is the installed base doing real work in factories today. |
| Counterpoint Research (Jan and Aug 2026) | Humanoid robot shipments | ~16K units in 2025; 22K+ in H1 2026 (about +300% YoY); 50K+ forecast for 2026; China = 80%+ in 2025; 100K+ cumulative by 2027; 69.7% CAGR to 2030 | N/A | 2025–2030 | Most units are developer kits, research platforms, and entertainment deployments, not robots doing productive autonomous work: 60%+ of H1 2026 shipments went to entertainment, data production and research, 13% to industrial manufacturing and 5% to warehousing. “Units shipped” ≠ “units deployed productively.” |
| ABI Research (Jul 2025) | Humanoid market size & units | $6.5B by 2030; 138% CAGR; 115K units by 2027 | N/A | 2024–2030 | More conservative near-term than Goldman. Market “heats up” in 2027, not 2025–2026. Inflection depends on regulatory, safety, and ROI issues being resolved. |
| Deloitte (Nov 2025) | Industrial robot installed base (all types) | 5M+ cumulative by 2025; 5.5M by 2026 | N/A | 2025–2026 | Conservative. Growth stays “relatively modest” without solving data quality, integration, and cybersecurity bottlenecks. |
What to Watch in 2026
| Subject | Key Source(s) | Expected Next Release |
|---|---|---|
| Humanoid robot market forecasts | Goldman Sachs Research | Periodic updates; last major labor report Mar 2026. Watch for revised humanoid market estimates based on 2025 actual data |
| Physical AI foundation models | Physical Intelligence (π) / NVIDIA Cosmos | Continuous; watch for cross-embodiment generalization milestones and commercial licensing |
| Independent humanoid benchmarks (new field) | NIST baseline benchmark; Fraunhofer IPA test program; DexBench (RLWRLD + NVIDIA); AGIBOT World Challenge sim leaderboard | All launched May–Jun 2026; no cross-robot results published as of mid-September 2026. Watch for first NIST results and Fraunhofer tests of additional platforms; these become the field’s first comparable time series |
| Robotic training data investment | DoorDash Tasks, Uber AI Solutions, Scale AI | Ongoing; watch for scale of gig-worker data programs and whether data costs decline as world models mature |
[1] Fraunhofer IPA humanoid robot benchmark, first published results (May 2026): six application-relevant criteria; Unitree G1 measured walking speeds 0.49 m/s (normal) and 0.84 m/s (fast); 3-kg payload did not reduce walking speed but slowed acceleration by tenths of a second. Human reference walking speed ~1.4 m/s. ipa.fraunhofer.de ↩
[2] Humanoid Everyday benchmark (arXiv, Oct 2025): 260 everyday tasks evaluated on real robot hardware; approximately 51% average task success across baseline systems; 0% success on high-precision insertion tasks. ↩
[3] NIST proposed baseline humanoid performance benchmark (May 2026), the first U.S. humanoid standardization effort since the 2015 DARPA Robotics Challenge. RLWRLD + NVIDIA DexBench launch (Jun 9, 2026). AGIBOT World Challenge 2026 at ICRA Vienna (Jun 2026): 526 teams from 27 countries; online simulation evaluation plus real-robot finals; public simulation leaderboard planned. ↩
[4] World Labs raised $1B at $5.4B valuation (Feb 2026); AMI Labs (Yann LeCun) raised $1.03B at $3.5B valuation (Mar 2026). Sources: Not Boring newsletter (Mar 2026); company announcements. NVIDIA Cosmos platform released progressively from CES 2025 through Feb 2026. ↩
[5] Physical Intelligence, “Our First Generalist Policy” (Oct 2024); open-sourced Feb 2025. $600M raised Nov 2025 at $5.6B valuation. The Robot Report (Nov 26, 2025). pi.website ↩
[6] Two additional constraints, regulatory/liability vacuum and maintenance/field support infrastructure, also impede deployment. No ISO standard exists for dynamically balancing legged robots working near humans, and the liability question (manufacturer vs. deployer vs. AI provider) is unresolved in all jurisdictions. Maintenance infrastructure (trained technicians, spare parts, 24/7 support) does not exist at scale for humanoids. These constraints are institutional rather than technical, but they may prove equally binding in practice. ↩
[7] Srinivasan, Suraj, Wilbur Xinyuan Chen, and Saleh Zakerinia. “Displacement or Complementarity? The Labor Market Impact of Generative AI.” Harvard Business School Working Paper (Dec 2024, updated Aug 2025). Study scored 19,000+ tasks across 900+ U.S. occupations using OpenAI ChatGPT to categorize automation vs. augmentation potential. Job postings 2019–Mar 2025. After ChatGPT’s launch, postings for automation-prone roles decreased 13%; postings for augmentation-prone roles grew 20%. Skills required for automation-prone roles shrank 7%. hbs.edu ↩
[8] Goldman Sachs Research, “How Will AI Affect the US Labor Market?” (Mar 18, 2026). Joseph Briggs, co-lead of the global economics team. Base case: 6–7% of workers displaced over ~10 years; 0.6pp unemployment increase; construction jobs exposed to data center build-out increased 216,000 since 2022; ~500,000 net new jobs needed for power demand by 2030. goldmansachs.com ↩
Sources
[1] Fraunhofer IPA, humanoid robot benchmark first results (May 2026). ipa.fraunhofer.de
[2] Humanoid Everyday benchmark (arXiv, Oct 2025).
[3] NIST baseline humanoid benchmark (May 2026); RLWRLD + NVIDIA DexBench (Jun 9, 2026); AGIBOT World Challenge 2026, ICRA Vienna.
[4] Physical Intelligence, π0 (Oct 2024; open-sourced Feb 2025; $600M Nov 2025). pi.website
[5] NVIDIA, Isaac GR00T N1 (Mar 2025; N1.6 2026) and Cosmos; World Labs and AMI Labs (company announcements, Feb–Mar 2026).
[6] Open X-Embodiment Collaboration / Google DeepMind, RT-2 / RT-X (2023, updated 2025).
[7] Srinivasan, Chen & Zakerinia, “Displacement or Complementarity?” HBS Working Paper 25-039 (Dec 2024, updated Aug 2025). hbs.edu
[8] Goldman Sachs Research, “How Will AI Affect the US Labor Market?” (Mar 18, 2026); “Humanoid Robot: The AI Accelerant” (Jan 2024). goldmansachs.com
Companion workbook. technology-ai-blue-collar.xlsx: shared robotics and physical AI workbook covering the technical constraints scorecard, occupation automation risk matrix, market-forecast and company-landscape data, and robot installation and density series