
CRE42 Office REIT Composite
Selected Office REITs
The CRE42 office composite blends three public office REITs chosen to span the two poles of the US office market. BXP (BXP, Inc.) is the largest publicly traded owner and developer of gateway-market CBD office, concentrated in Boston, New York, Washington DC, San Francisco, Seattle, and Los Angeles. Cousins Properties (CUZ) owns Sun Belt trophy office concentrated in Atlanta, Austin, Charlotte, Tampa, Phoenix, Dallas, and Nashville. Highwoods Properties (HIW) owns "best business district" office across Raleigh, Nashville, Atlanta, Charlotte, Tampa, Richmond, Orlando, and Dallas. One gateway landlord plus two Sun Belt landlords give the composite exposure to both halves of the post-2020 office divergence.
Component Pricing and Scale
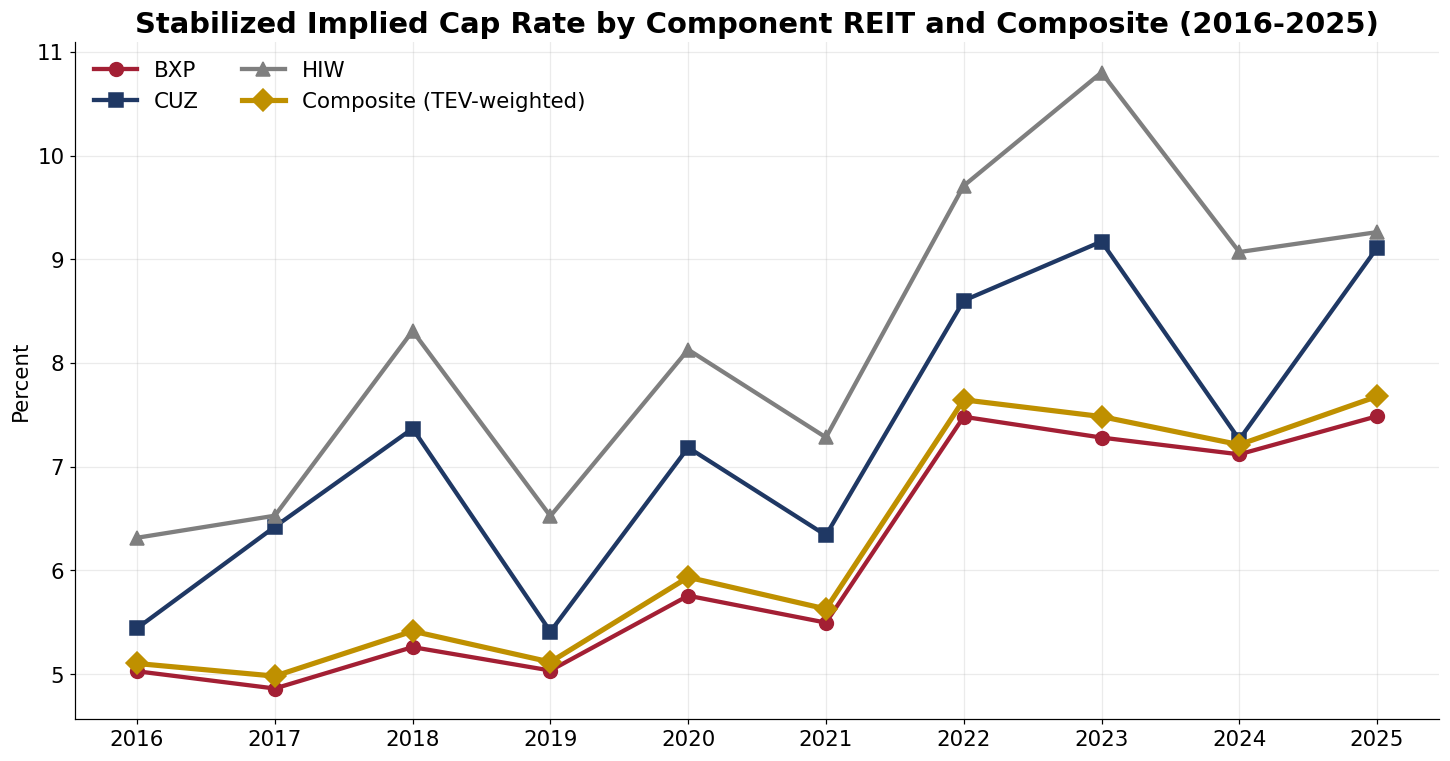
Source: Component FY2016–FY2025 Form 10-K and Q4 supplemental filings; CRE42-derived measures per the companion workbook.
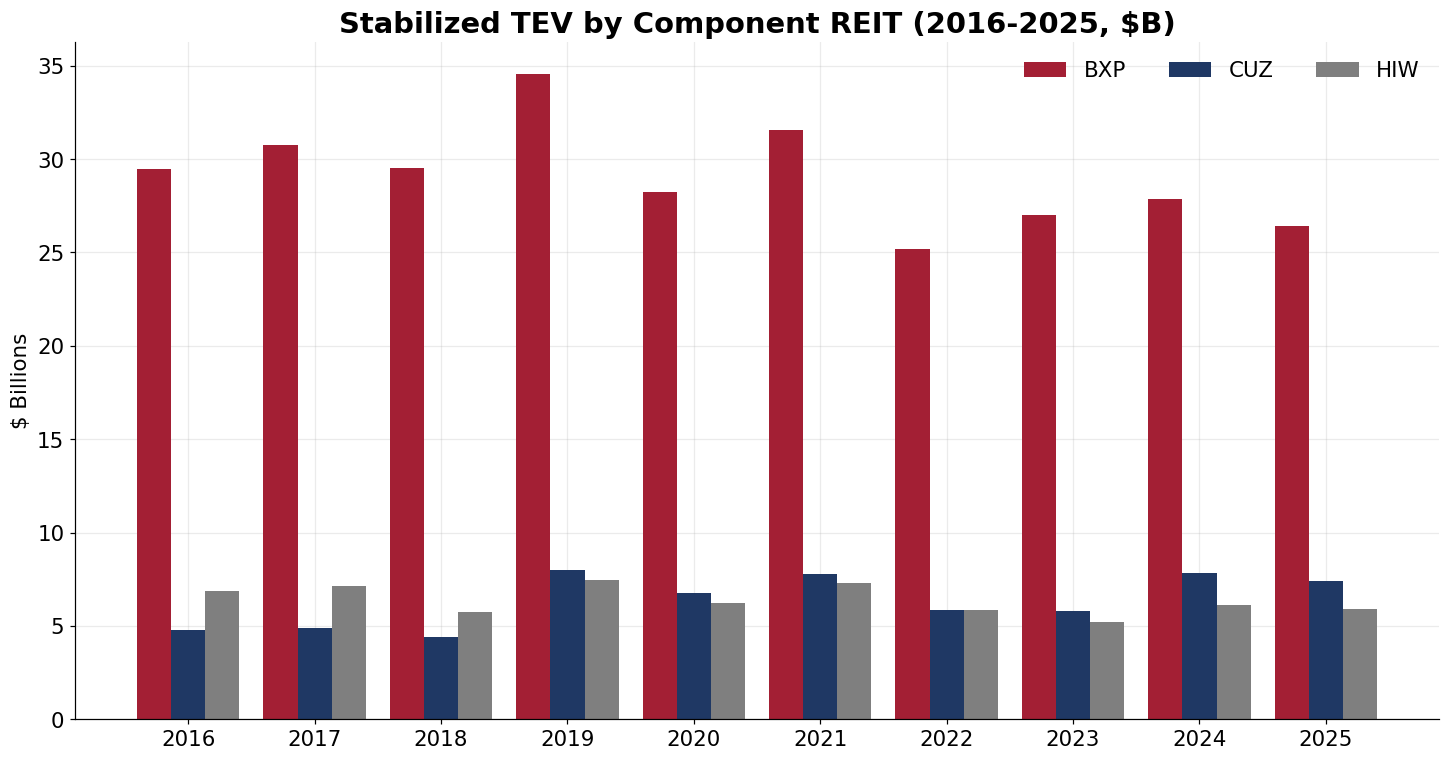
Source: Component FY2016–FY2025 Form 10-K and Q4 supplemental filings; CRE42-derived measures per the companion workbook.
Composite Construction
Every company-sourced figure (NOI, interest, land, development, debt, FFO, leasing costs, cash flow, distributions) is a TEV-weighted average across the three REITs, weighted by each REIT's stabilized TEV for that fiscal year. Calculation columns keep the identical formulas used on the single-company tabs, so the composite reads like a single large office REIT. The composite share price is composite market cap divided by composite share count, never a direct average of the three prices. Preferred stock (BXP's Series B through 2020, HIW's Series A throughout) is treated as debt at liquidation value. All figures are aggregate composite, not per share.
Notes
The composite is a synthetic construction; it is not a filing of any single company. Component figures trace to each company's Form 10-K and Q4 supplemental for each fiscal year, per the Sources tab of the companion workbook. A regional footprint cross-section (portfolio square footage by region and market) requires a separate property-table extraction and is not yet built for the office components.
Companion workbook. office-reit-metrics.xlsx – CRE42 office REIT composite annual model (FY2016–FY2025), per-REIT and vs-market tabs, and market comparison data.