Total US Economy Debt: Overview and Analysis

Total US nonfinancial debt grew from $16 trillion at fiscal year-end 1996 to $84 trillion in FY2025, a 5.2x increase versus 3.8x nominal economic growth (GDP) over the same period[1][3].

Debt by Sector in Dollars
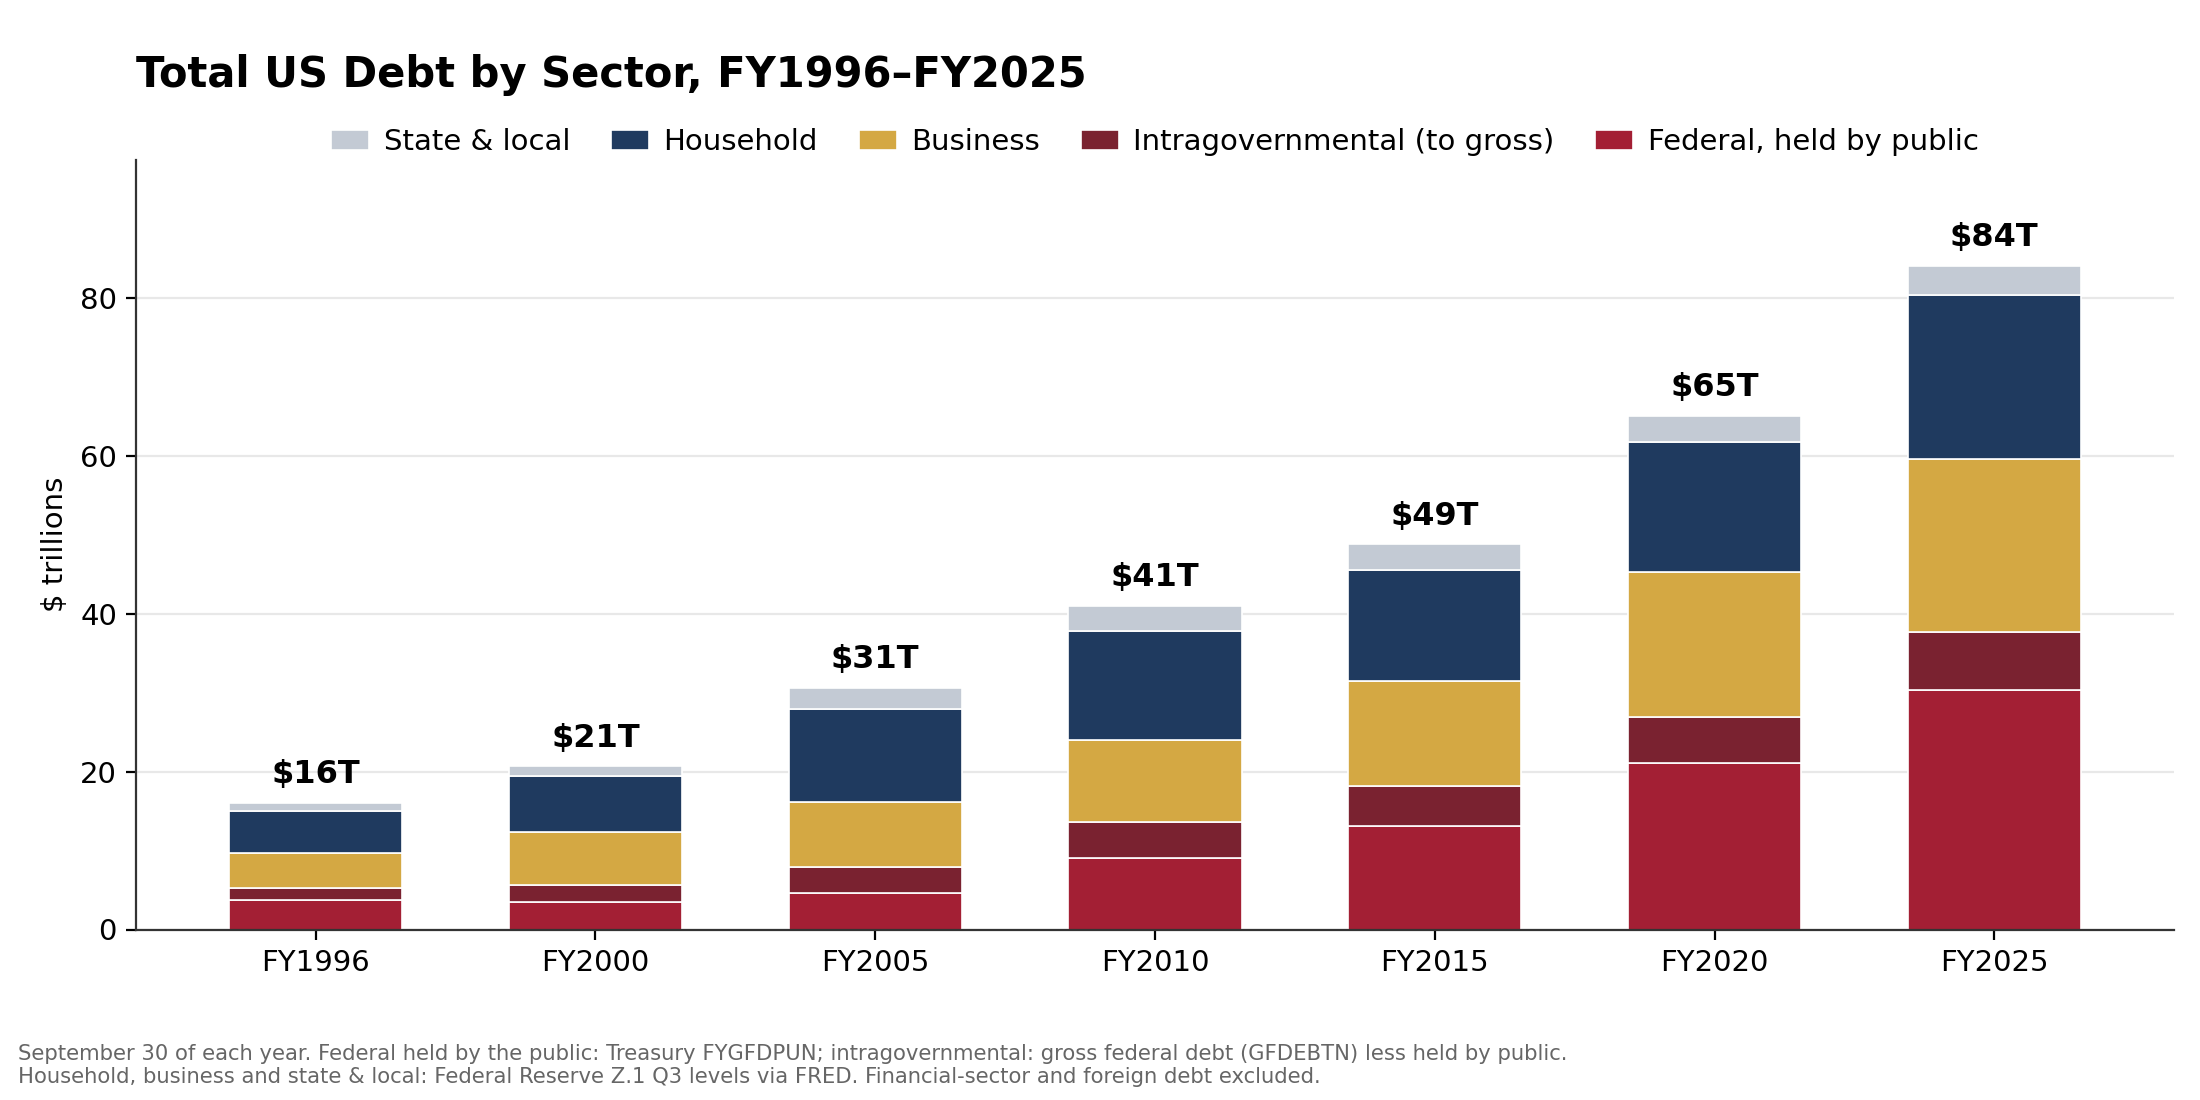
Total US debt by sector FY1996-FY2025 in dollars: stacked bars at five-year snapshots growing from $16T to $21T, $31T, $41T, $49T, $65T and $84T across federal held by the public, intragovernmental, business, household, and state and local

Fiscal year-end (September 30) snapshots at five-year intervals. Federal held by the public: U.S. Treasury FYGFDPUN; intragovernmental: gross federal debt (GFDEBTN) less debt held by the public. Sources: U.S. Treasury and Federal Reserve Z.1 via FRED | Chart: CRE42.com

Chart Details: sector debt in dollars, with change between snapshots
Sector ($B)FY1996% chgFY2005% chgFY2015% chgFY2025% chg
Federal, held by public3,7344,592+23%13,117+186%30,167+130%
Intragovernmental1,4473,313+129%5,003+51%7,208+44%
Business4,5188,273+83%13,303+61%22,031+66%
Household5,23711,757+125%14,098+20%20,774+47%
State & local1,0422,646+154%3,252+23%3,667+13%
Total (incl. intragov)15,97830,581+91%48,773+59%83,847+72%

$ billions at fiscal year-end (September 30). Percent change is versus the prior snapshot column, not annualized. Federal split into held-by-public and intragovernmental; the two sum to gross federal debt. Source: Sector Debt tab, companion workbook.

Key Observations

The federal share of total US non-financial debt rose from 32% to 45%. Federal debt held by the public, $30.2 trillion, now exceeds the debt of all US business combined, $22.0 trillion, before counting the $7.2 trillion the government owes its own trust funds.
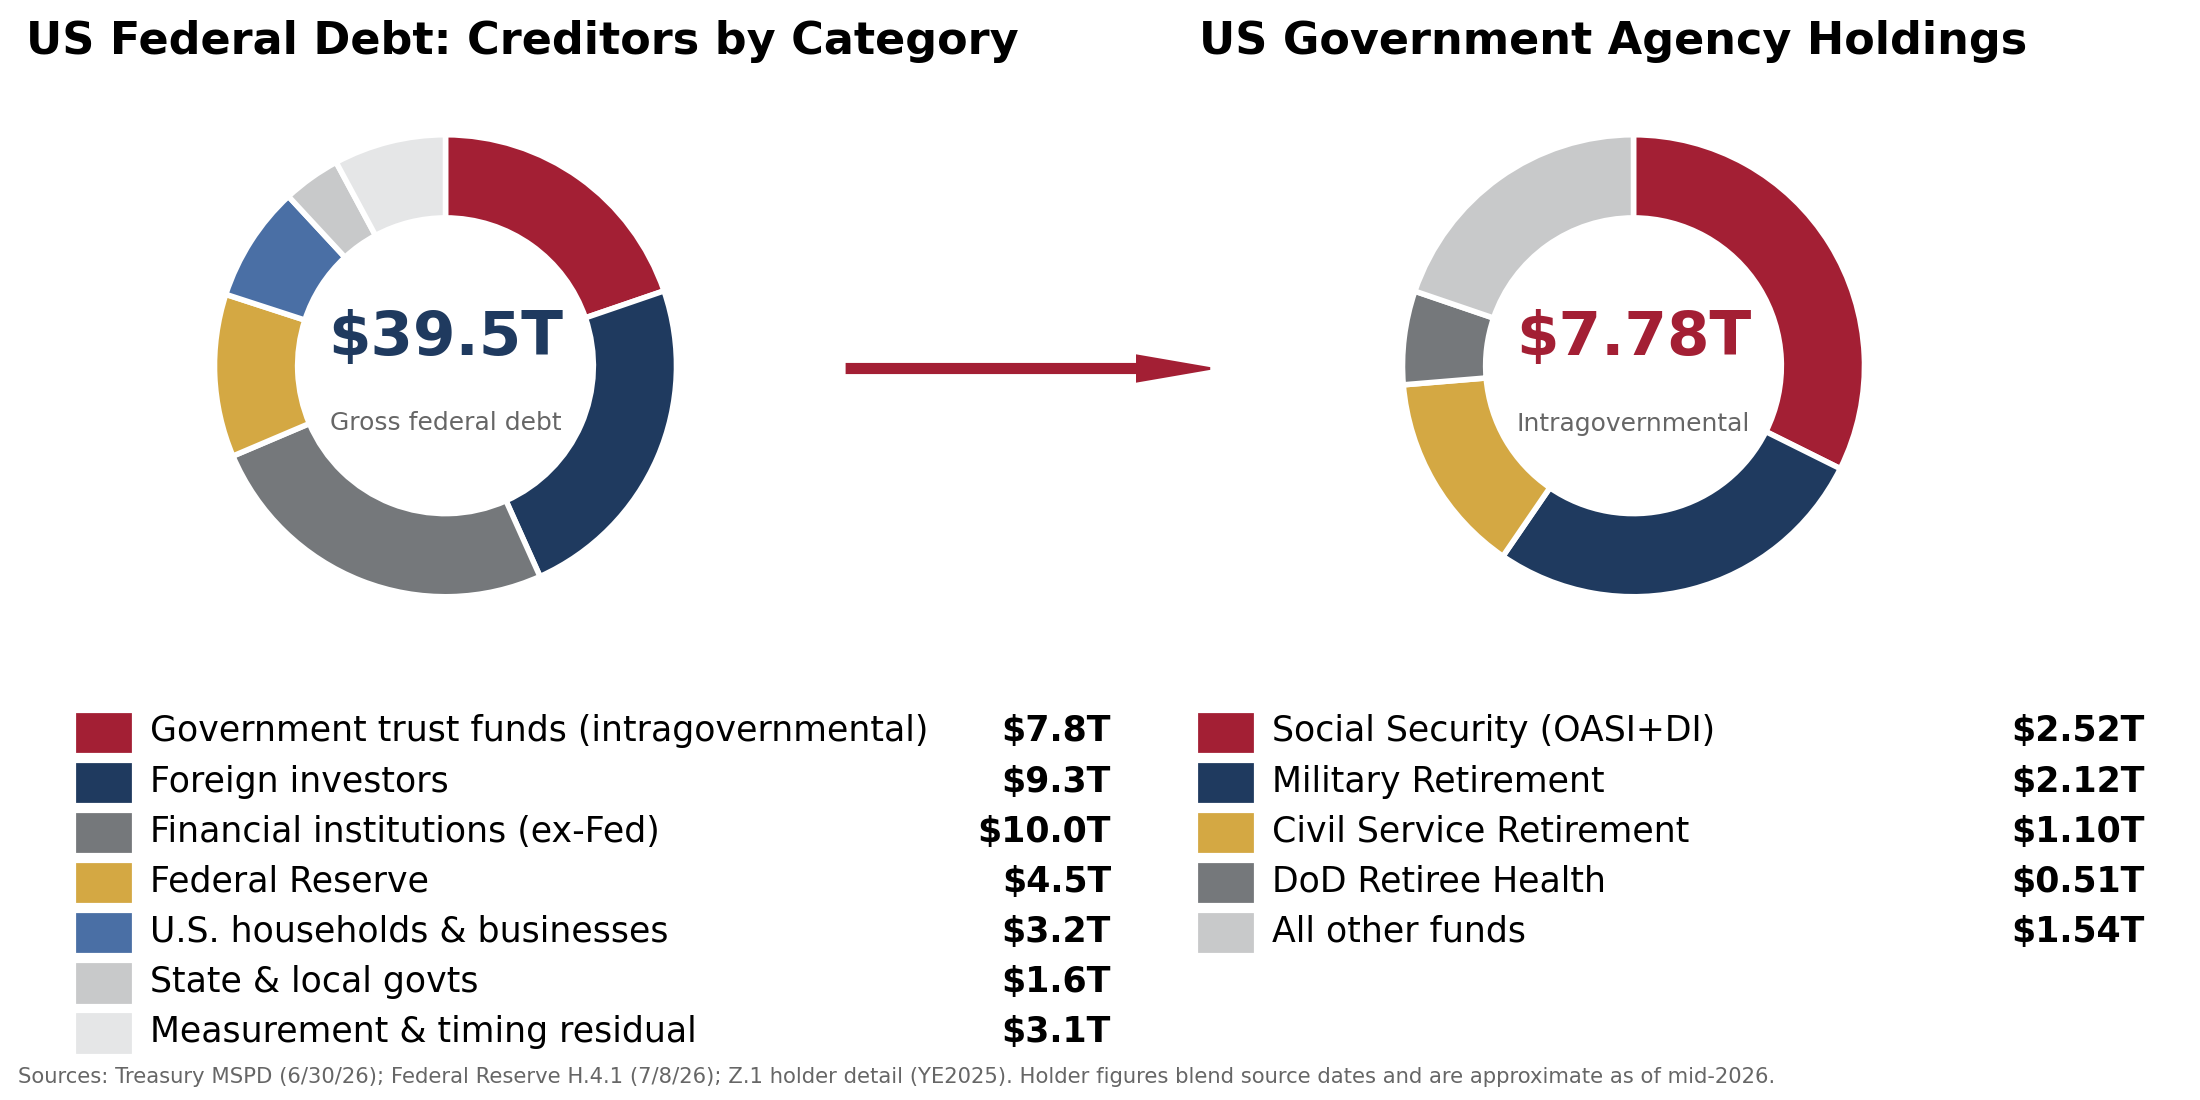
Intragovernmental debt (see donut chart below) grew from $1.4 trillion to $7.2 trillion. It is debt the Treasury owes other governmental agencies (e.g. Social Security trust funds) reconciled on the Debt Comparisons tab of the companion workbook.

Debt by Sector as a Share of GDP

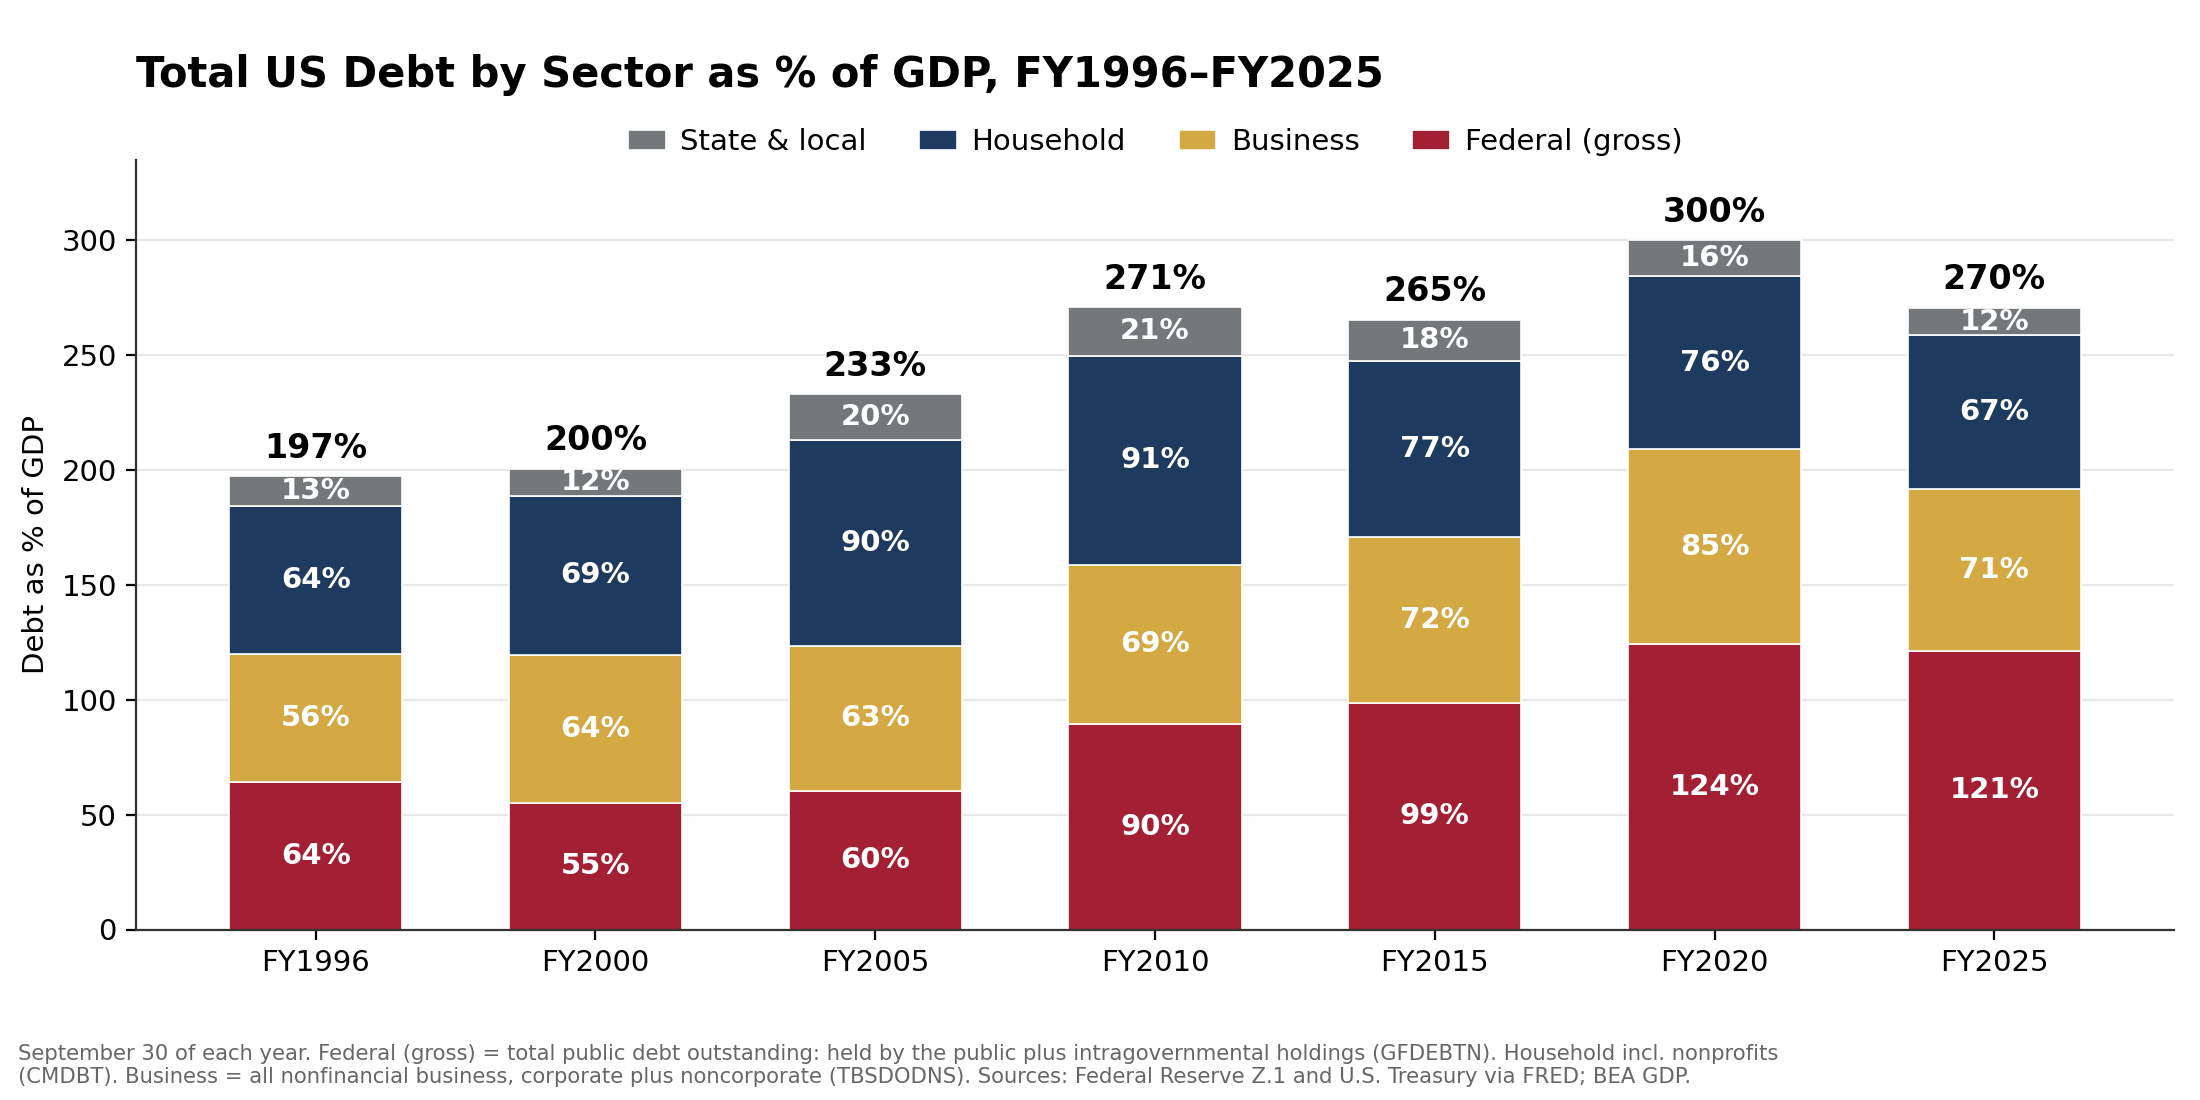
Total US debt by sector as percent of GDP FY1996-FY2025: total leverage flat near 270% since 2010 while composition shifted from household to federal

Total US Economy leverage has been essentially flat for fifteen years: 271% of GDP in FY2010, 270% in FY2025, with a pandemic peak of 300% in FY2020. In aggregate, the economy did not delever after 2008 and has not relevered since. Federal debt has grown much faster than other categories (see chart below).
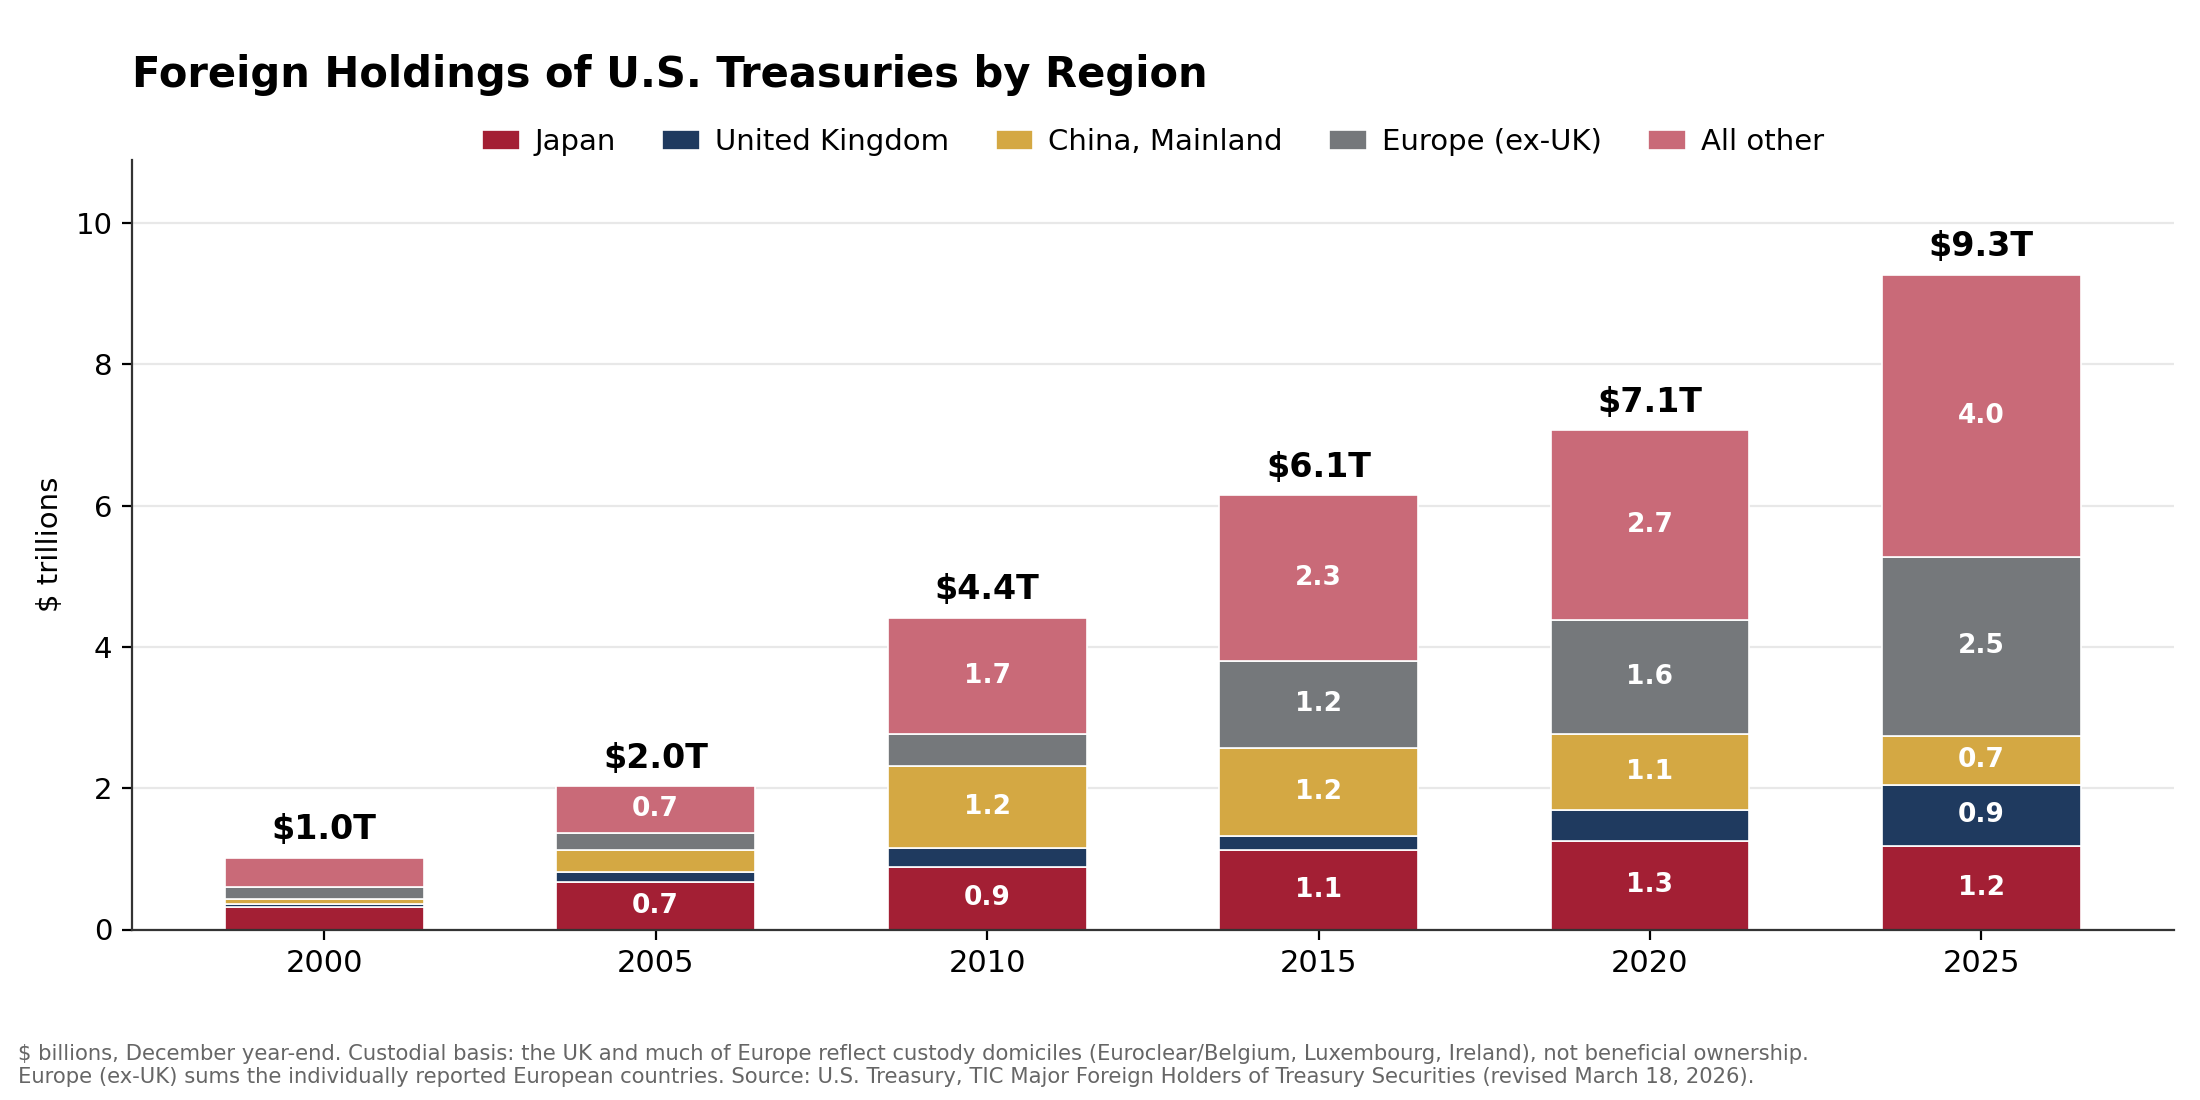
Foreign holdings of US Treasuries by region 2000-2025: stacked bars of Japan, the UK, China, Europe ex-UK and all other rising from $1.0T to $9.3T

Foreign holdings of US Treasury securities by region, December year-end. Custodial basis: the UK and much of Europe reflect custody domiciles, not beneficial ownership. Source: U.S. Treasury, TIC Major Foreign Holders of Treasury Securities (revised March 2026) | Chart: CRE42.com
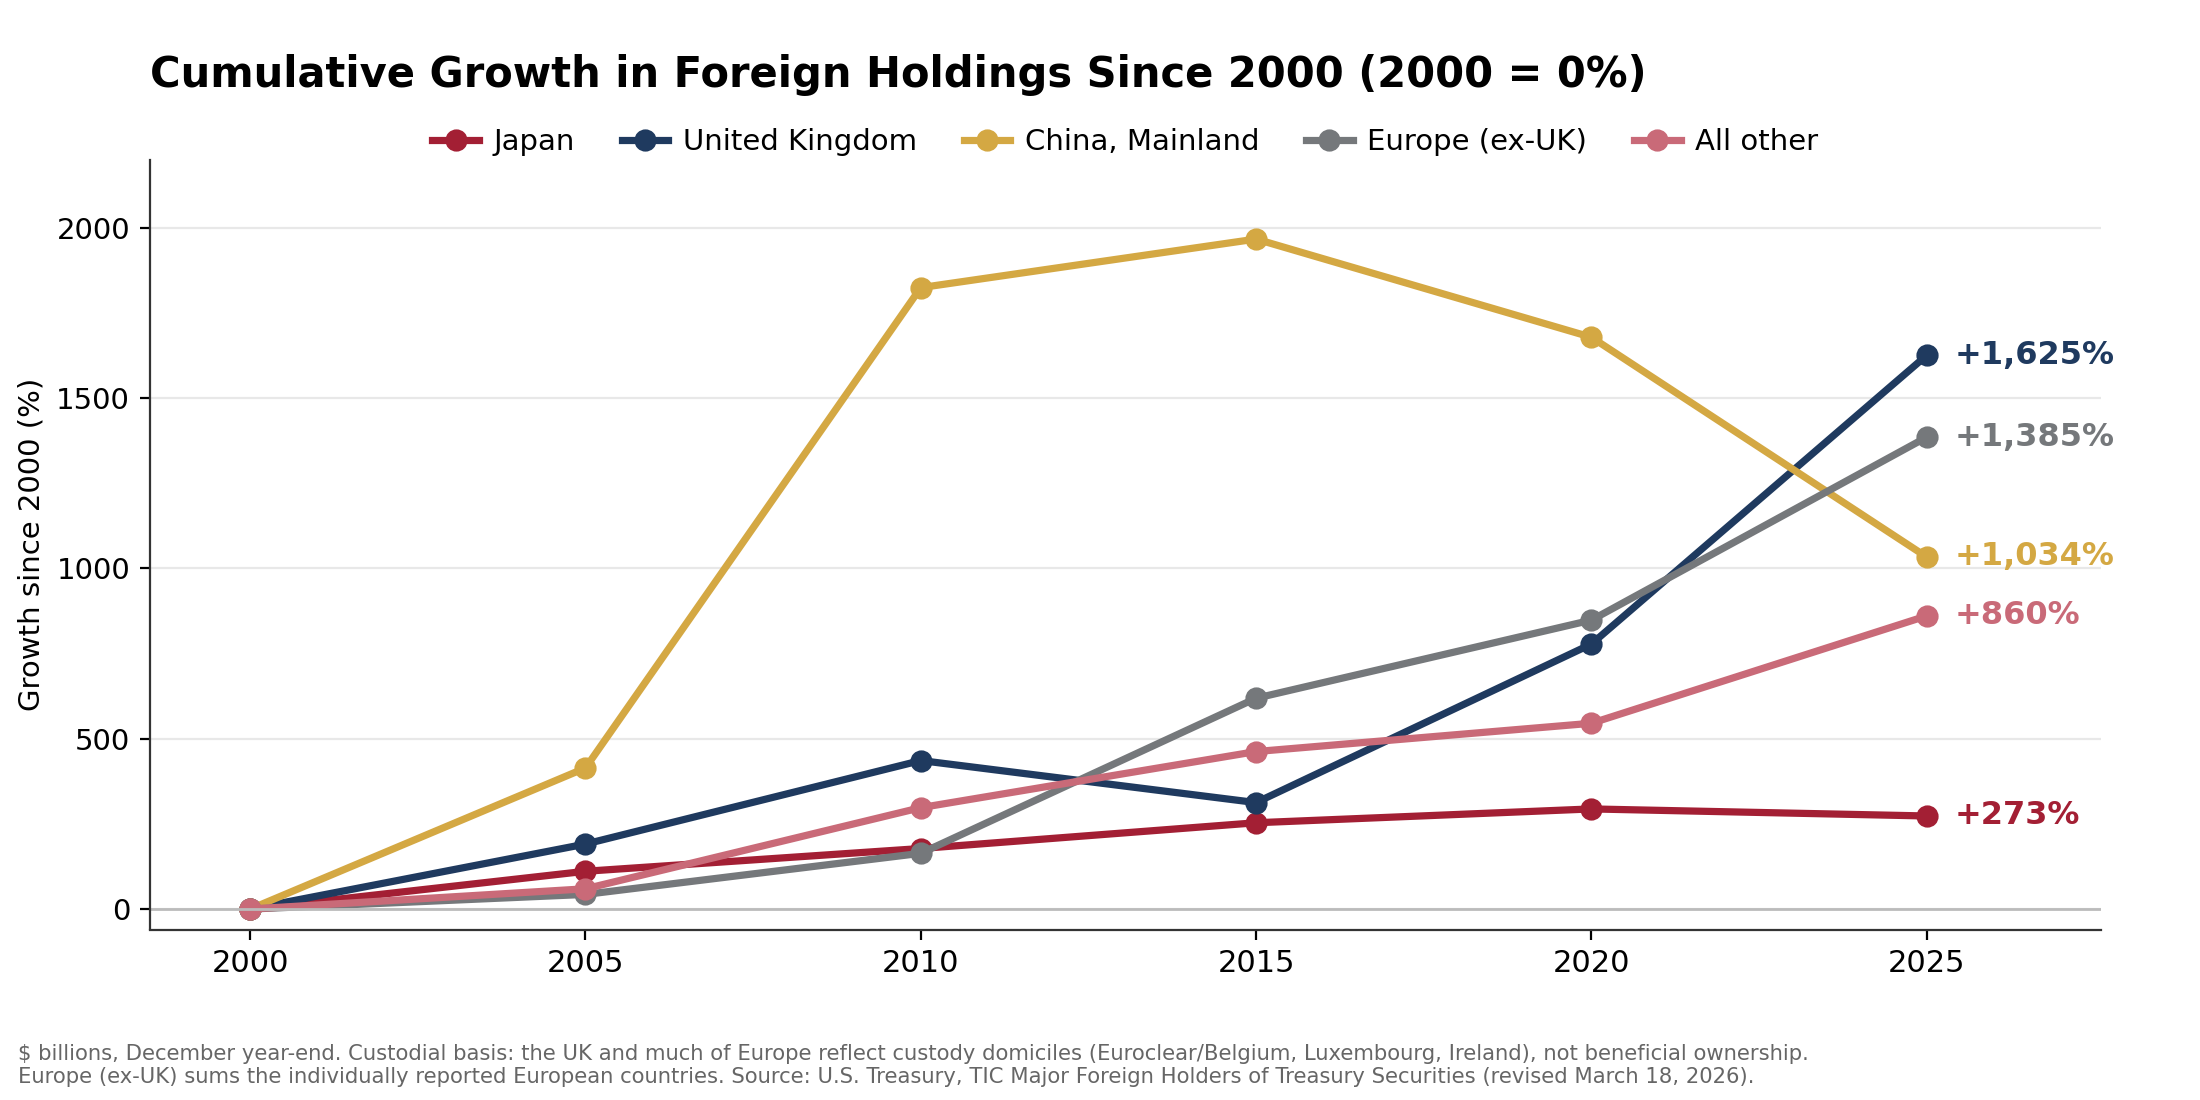
Cumulative growth in foreign holdings of US Treasuries since 2000 by region: China peaks near 1,970% in 2015 then falls to 1,034%, while the UK rises to 1,625% and Europe ex-UK to 1,385%; Japan is lowest at 273%

Cumulative growth in foreign holdings since 2000, by region, on the same custodial basis as the chart above. Source: U.S. Treasury, TIC Major Foreign Holders of Treasury Securities (revised March 2026) | Chart: CRE42.com
Foreign holdings of US federal debt increased from $1.0 trillion to $9.3 trillion from 2000 to 2025, a total increase of 9.1x.
Total US federal debt increased by 6.8x over the same period, while GDP grew by 3.0x.
US federal debt creditors by category: $39.5T gross federal debt by holder (left), and US government agency holdings of $7.78T broken out by trust fund (right)

Who holds the $39.5T gross federal debt (left), and the $7.78T the government owes its own trust funds, broken out by fund (right). Sources: Treasury MSPD, Federal Reserve H.4.1 and Z.1 | Chart: CRE42.com

Holder figures blend source dates (Treasury MSPD June 30, 2026; Federal Reserve H.4.1 July 8, 2026; Z.1 year-end 2025) and are approximate as of mid-2026; the trust-fund breakdown (right) is exact per MSPD June 30, 2026. A single-date rederivation is scheduled with the next section update.
US federal debt owed to intragovernmental agencies is currently 19.7% of the total federal debt.
Intragovernmental holdings of US federal debt will be drawn down as retirement and medical entitlement expenses increase in accordance with the aging of the baby boomer generation.
All else equal, the US Treasury will need to issue fresh bonds to replace entitlement funding.
This replacement debt will require actual debt service (current intragovernmental debt functions like a zero-rate IOU).
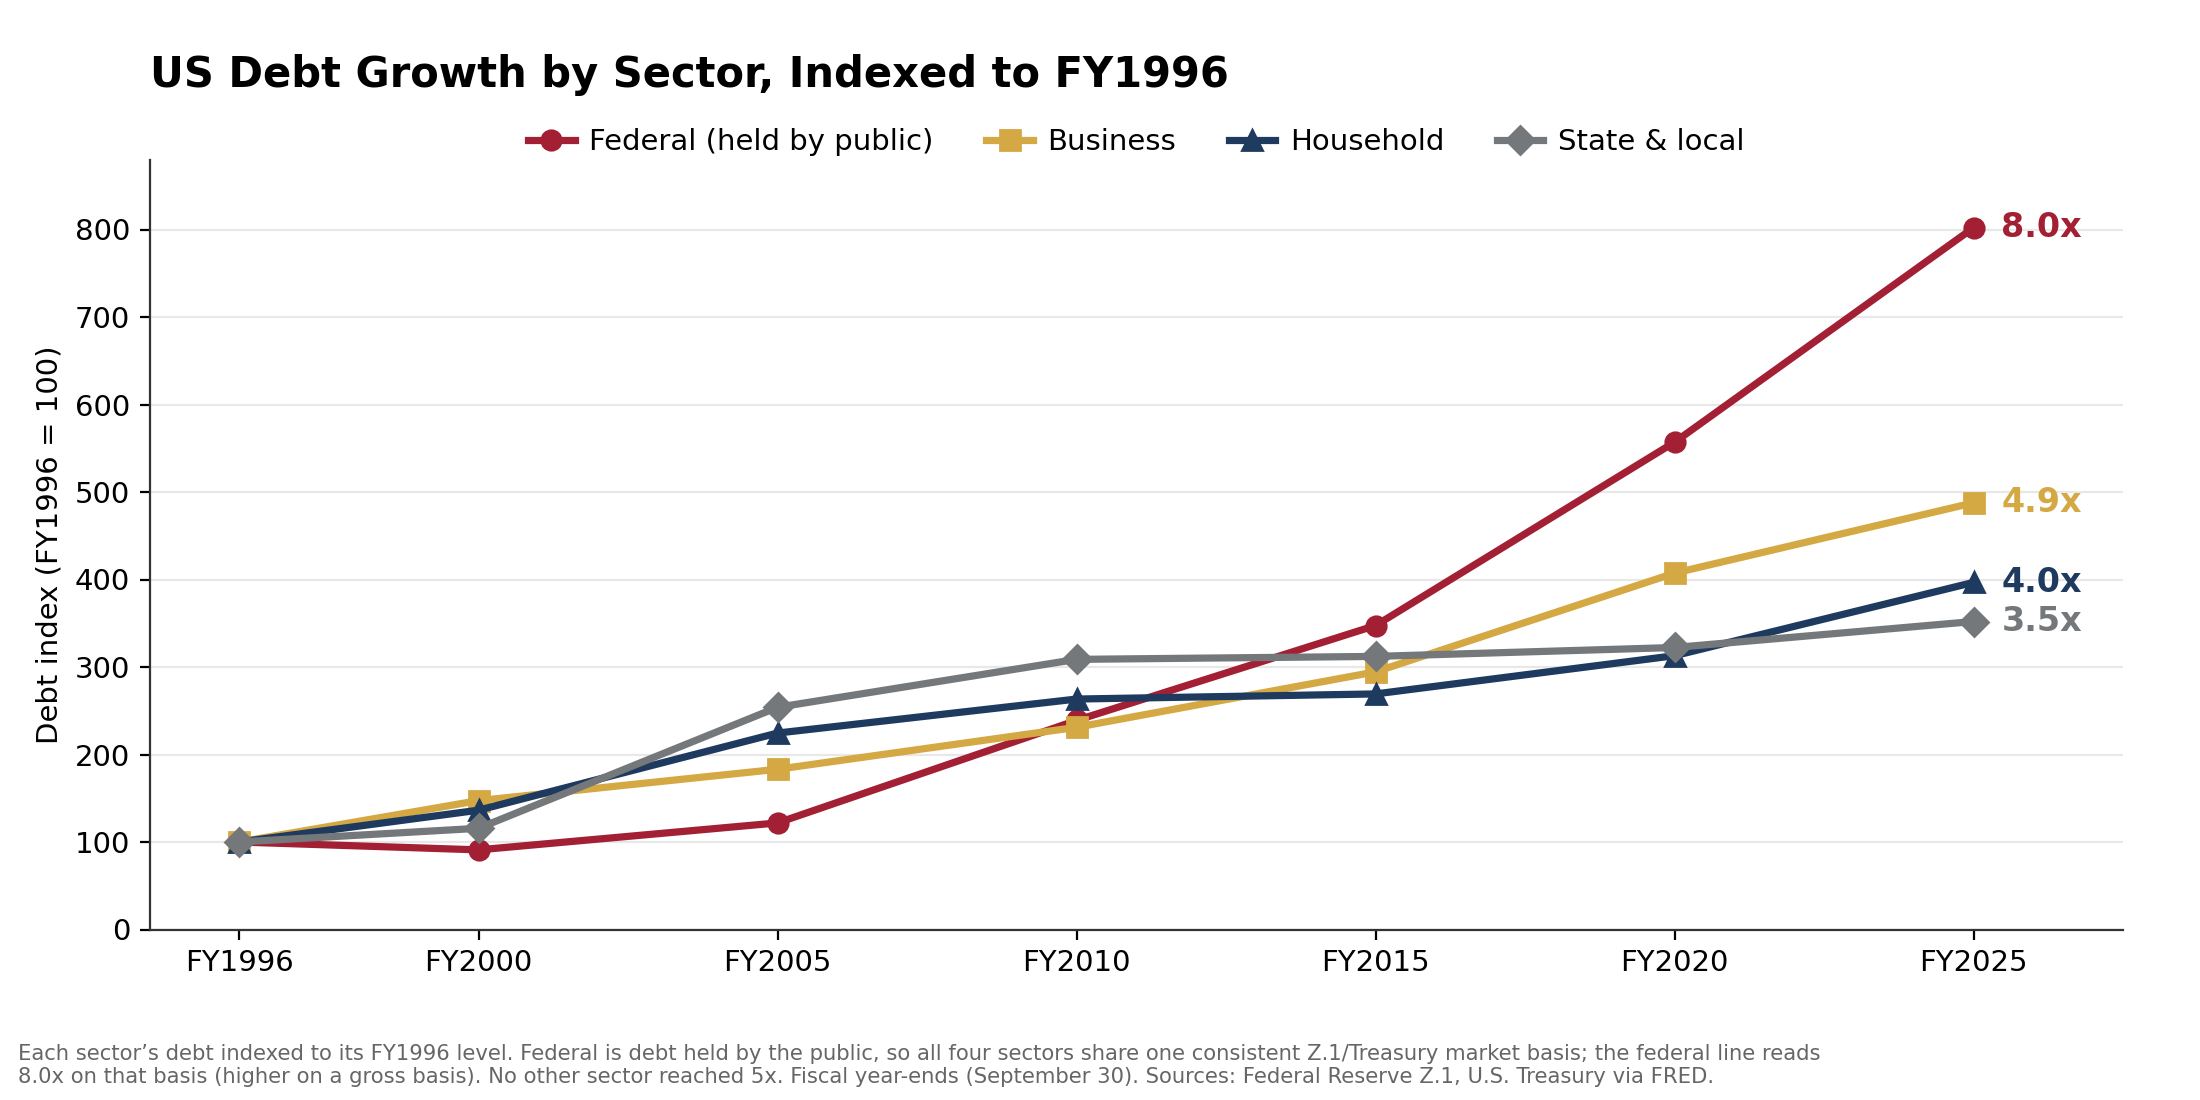
US debt growth by sector indexed to FY1996: federal held-by-public up 8x, business 4.9x, household 4x, state and local 3.5x

Each sector’s debt indexed to its FY1996 level. Federal is debt held by the public, so all four sectors share one consistent Z.1/Treasury market basis; the federal line reads 8.0x on that basis (higher on a gross basis). No other sector reached 5x. Sources: Federal Reserve Z.1, U.S. Treasury via FRED | Chart: CRE42.com

Household debt fell from 91% of GDP in FY2010 to 67% in FY2025, its lowest share since the 1990s, although it rose from $13.8 trillion to $20.8 trillion in nominal terms, a 50.6% aggregate increase over that time.
Federal debt rose from 90% to 122% of GDP, from $13.6 trillion to $37.6 trillion gross over FY2010–FY2025.
Business debt rose in dollars but fell as a share of GDP: $18.4 trillion to $22.0 trillion from FY2020 to FY2025, up 20%, while the ratio fell from 85% to 71%, because nominal GDP grew 44% over the same five years.
State and local debt has held a narrow band, 12–21% of GDP, for thirty years, and sits at 12% today. State and local governments are generally required to run balanced budgets.

US Multi-Decade Shift from Credit Risk to Inflation Risk

As the relative total US debt burden moves from households and businesses to the federal government, overall economic risk shifts from default to inflation. Unlike businesses and individuals, the US government can essentially print money to pay debt, increasing the money supply and potentially sparking inflation (see the Money Supply page).

FY2008–FY2012: household debt fell in nominal dollars, $14.5 trillion to $13.6 trillion, and did not regain its FY2008 level until FY2015. Defaults and repayment contracted private credit, quantitative easing swapped bonds for bank reserves rather than creating broad money, and inflation spent the decade below the Federal Reserve’s 2% target.
FY2020–FY2021: pandemic-related support resulted in $5.9 trillion of combined federal deficits, mostly in the form of transfers and support payments to households and businesses. M2 rose roughly 40% in two years (see the Money Supply page) and CPI inflation followed within eighteen months.
FY2022–FY2025: even after pandemic-era transfer payments ceased, the federal deficit reached almost 6% of GDP despite peacetime full employment by FY2025.
Options for resolving federal debts and deficits

When debts and deficits become unsustainable, governments are essentially left with five options to return to fiscal equilibrium.

Economic growth: Real growth exceeding inflation is the cleanest exit, although rare in practice once debts reach levels requiring high and consistent growth.

Additional taxation: Increasing federal tax rates can help, but only to a certain point because increasing taxes tends to decrease economic growth and activity, which in turn reduces the taxable base.

Reduce expenditures: Outlay reductions close the gap from the spending side. This strategy is extremely difficult at scale, because interest, retirement, and health programs make up most of the budget.

Inflation: Nominal GDP and tax receipts grow with the price level while existing debt obligations stay fixed. Debt shrinks in real terms; bondholders absorb the adjustment. This also is only partially effective because future bond yields will need to rise to compete with inflation, reducing the value of the bonds and forcing increased sales to cover the same annual deficits.

Financial repression: Interest rates are held below inflation while regulation and captive buyers sustain demand for the debt. This strategy can lead to unintended consequences including asset bubbles and a reduction in the savings rate.

Between FY1946 and FY1970, gross federal debt fell from over 100% of GDP to roughly a third (34.6% by FY1970, per the companion workbook), with growth, inflation, and capped interest rates.

What to Watch For in 2026 and Beyond

Sources to Track the US Debt Stack:

SourceReport or SeriesFrequencyNotes
Federal ReserveZ.1 Financial AccountsQuarterly, ~10 weeks after quarter-endThe full sector detail; Q2 2026 release due September
FREDCMDBT, TBSDODNS, GFDEBTNQuarterly mirrorsHousehold, business, and federal series behind both charts
OMBHistorical Table 7.1Annual, with the BudgetFederal public vs. intragovernmental split
U.S. TreasuryMonthly Treasury StatementMonthlyThe deficit flow that feeds the federal bars
BEAGDP (NIPA)QuarterlyThe denominator

Footnotes

[1] Coverage and bases: snapshots are September 30 of each year, where the OMB fiscal year-end coincides with the Z.1 Q3 quarter-end. Federal gross debt = debt held by the public plus intragovernmental holdings. Household includes nonprofit organizations (Z.1 series CMDBT). Business is all nonfinancial business, corporate plus noncorporate (TBSDODNS). Financial-sector and foreign debt are excluded to avoid double counting: financial-sector borrowing largely re-lends the sectors shown. GDP: BEA. Full series and reconciliations are on the Sector Debt and Debt Comparisons tabs of the companion workbook.

[2] Household nominal figures are Z.1 Q3 levels via FRED, from the companion workbook’s Sector Debt tab.

[3] Growth multiples: total US nonfinancial debt $15.98T (FY1996) to $83.85T (FY2025) = 5.25x. Nominal GDP $8,073B (calendar 1996) to $30,762B (calendar 2025) = 3.81x. Sources: Federal Reserve Z.1 and U.S. Treasury for debt; BEA GDPA via FRED for GDP.

Methodology & Data Notes

Companion Workbook

inflation-debt-in-context.xlsx: companion workbook for the Federal Debt Sustainability section. This page draws on the Sector Debt tab: quarterly Z.1 series, fiscal year-end snapshots, and the reconciliations behind both charts.