
- 1990–2019: U.S. inflation averaged 2.5% across three decades, stepping down from 3.0% in the 1990s to 2.6% in the 2000s and 1.8% in the 2010s, supported by globalization, technology, favorable demographics, and disciplined monetary policy.
- 2020+: Pandemic-era stimulus, supply chain breakdowns, and labor shortages pushed inflation to its highest levels since the early 1980s, peaking at 8.0% in 2022 and remaining elevated above the Federal Reserve's target inflation rate of 2.0%.
- Headline CPI has moderated from 2022 peaks, but several structural forces suggest inflation may remain elevated relative to the pre-2020 norm.
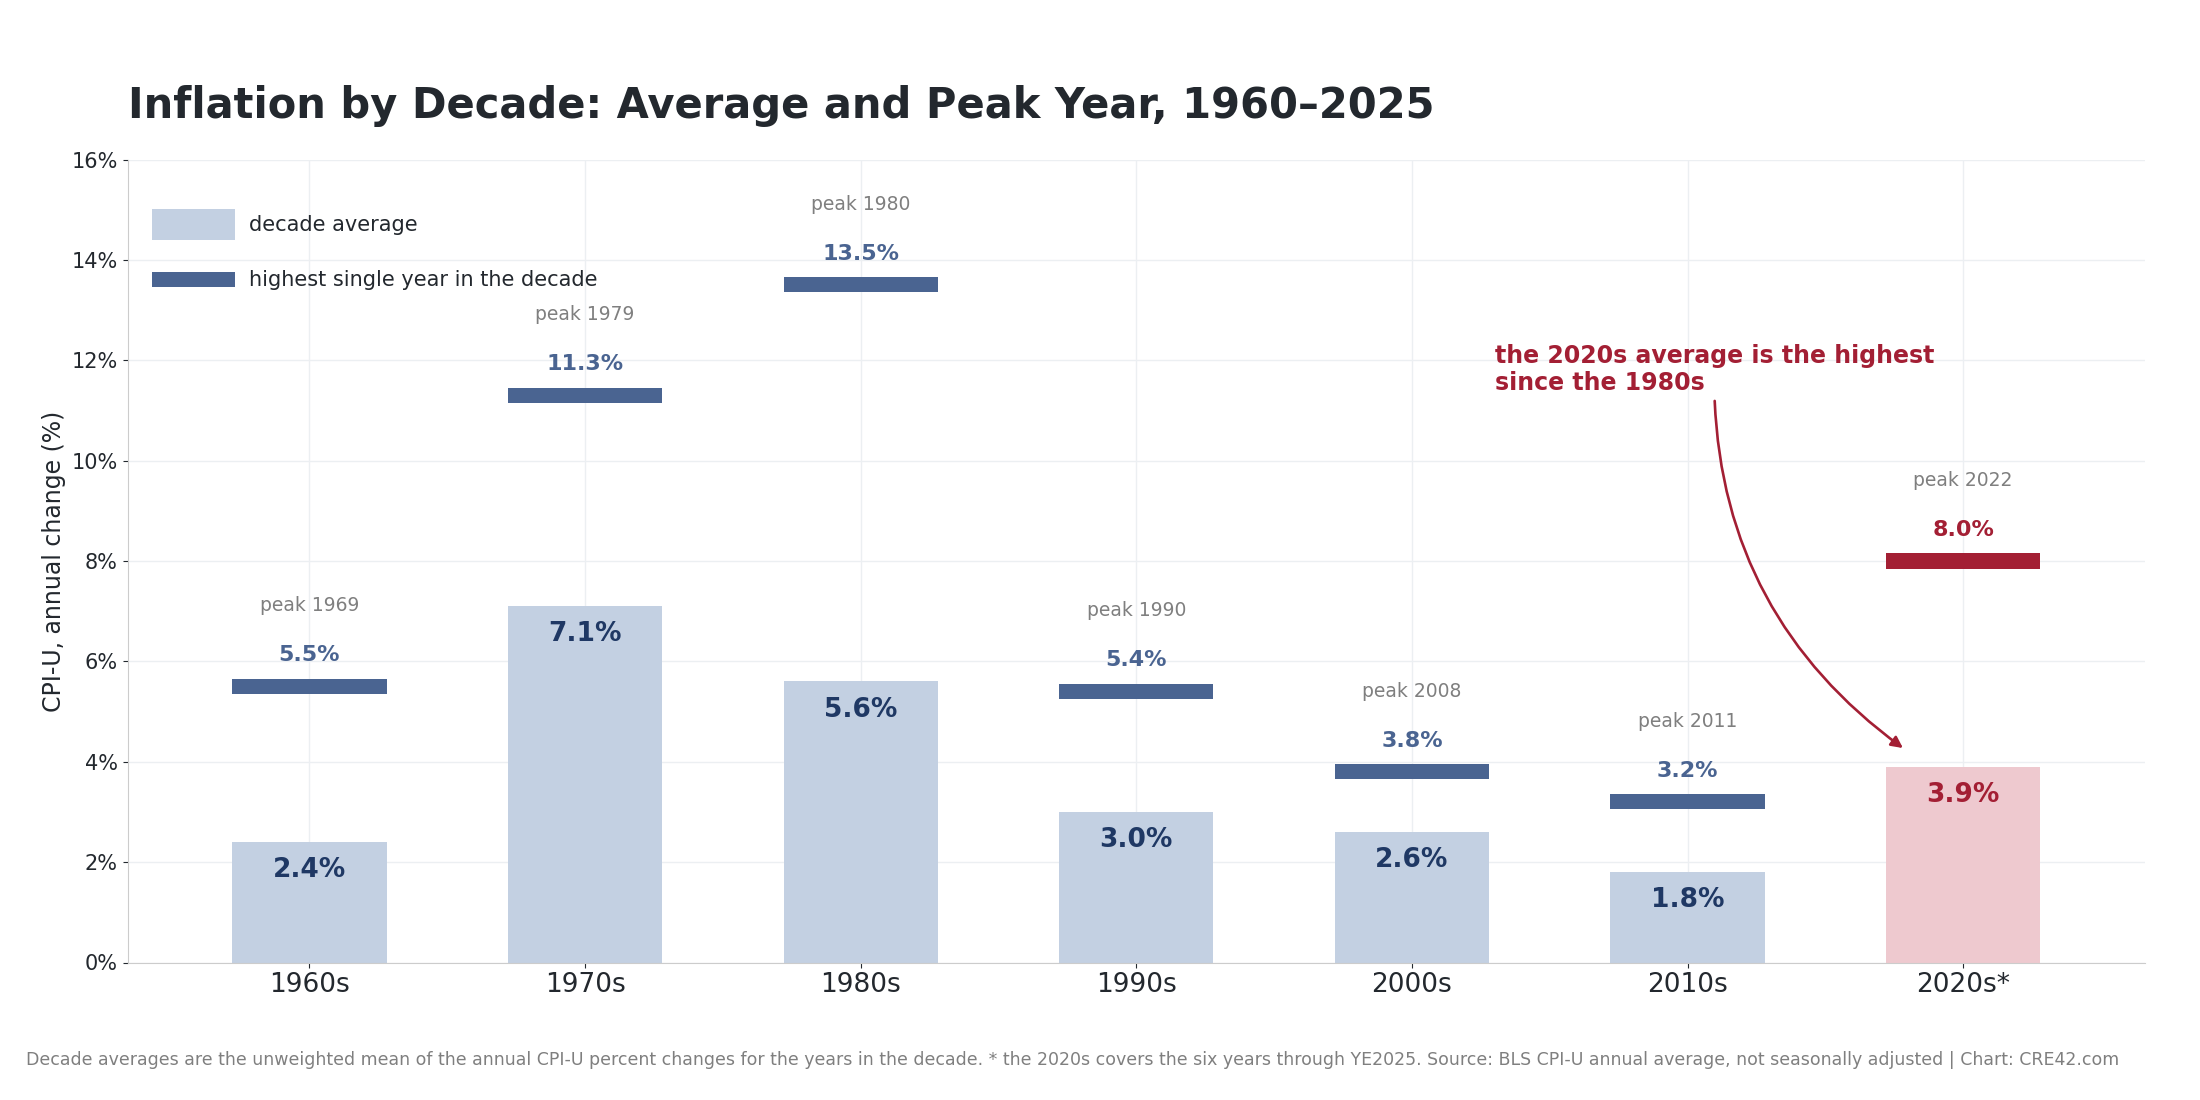
The column is the decade average; the floating bar above it marks the decade’s highest single year. Source: BLS CPI-U annual average, not seasonally adjusted | Chart: CRE42.com | * the 2020s covers the six years through YE2025
Key Observations
Detailed Context & Analysis
Inflationary Forces 1980–2019
Federal Reserve Chairman Paul Volcker and President Reagan are credited with breaking cyclical inflation in the early 1980s through aggressive rate hikes that pushed the federal funds rate to 20% in 1981. However, the fact that inflation remained generally low for the next 40 years was due to multiple powerful socio-economic forces:
- Weakened labor unions following the 1981 air traffic controllers' strike and also influenced by structural economic and demographic changes
- Rapid globalization and free trade agreements like NAFTA and China's WTO entry
- Stable energy costs as the U.S. fracking boom added millions of barrels per day to global supply
- Favorable demographics with baby boomers in prime working age
- Technology-driven productivity gains in logistics, manufacturing, and services
Reinflationary Forces 2020+
Many of the forces that suppressed inflation for four decades have either diminished or reversed:
- Labor Markets: Unions are regaining strength due to tight labor markets, shifting demographics, worker activism, and shifting public sentiment. High-profile labor actions in logistics, retail, and tech have secured higher wages and better conditions.
- Globalization Retreat: Trade policy has shifted toward protectionism, tariffs, and supply chain reshoring. The downward pressure that e-commerce and logistics technology exerted on goods prices has weakened as geopolitical tensions disrupt global supply chains.
- Demographics: Baby boomers are retiring, shrinking the labor pool. The U.S. avoided the aging crisis longer than Europe due to millennials, but declining birth rates and uncertain immigration policy threaten future workforce growth.
- Federal Debt: Gross U.S. federal debt reached $37.6 trillion at the end of FY2025 (122% of GDP) and $39.5 trillion by June 2026. Deficit spending adds to money supply; debt growth (6.1% in FY2025) exceeds nominal GDP growth (5.0%), a potentially inflationary trajectory. See National Debt vs. GDP Growth.
- Technology (Mixed Effects): AI and automation may be disinflationary long-term by replacing labor and increasing efficiency. However, the near-term AI infrastructure buildout (data centers, semiconductors, power generation) is capital-intensive and inflationary.
CRE Investment Implications
After four decades of enjoying a relatively stable and generally disinflationary environment, U.S. financial and real estate markets are now grappling with how to assess the risks of less stable pricing. If the 2020s represent a structural shift rather than a temporary post-pandemic spike, investors face a fundamentally different environment:
- Higher baseline interest rates and cap rates
- Elevated construction costs that may not retreat
- Greater uncertainty in underwriting assumptions for rent growth, exit cap rates, and development yields
Understanding and tracking the forces driving inflation (demographics, trade policy, debt levels, energy costs, and technology) will be essential for navigating CRE investment decisions in this evolving landscape.
Sources
U.S. Bureau of Labor Statistics: Consumer Price Index (CPI-U)
• Annual Average, Not Seasonally Adjusted | bls.gov/cpi
Federal Reserve Bank of St. Louis (FRED)
• fred.stlouisfed.org
U.S. Treasury Department: Federal Debt Data
• fiscaldata.treasury.gov
CRE42 companion workbook: inflation-by-decade.xlsx
• Decade summary, annual CPI-U (1960–2025), methodology